
The Sales by Item report is a flat, item-level view of every product variant sold during the selected date range. It's the report to use when you want to look up one specific item or one specific brand and see exactly how it performed, rather than rolling everything up to categories.
The report includes a quick summary at the top (items sold count, total net sales), filterable by category, brand, and tag, and the table itself shows quantity, gross sales, all the discount and tax columns, refunds, and net sales — sortable on every column.
Access path: Quickvee Web → Reporting → Sales Reports → select Sales by Item
%20%E2%86%92%20Reporting%20%E2%86%92%20Sales%20Reports-20260602-084058.jpg?cb=7e766321434a99e4aaa507d07104d657)
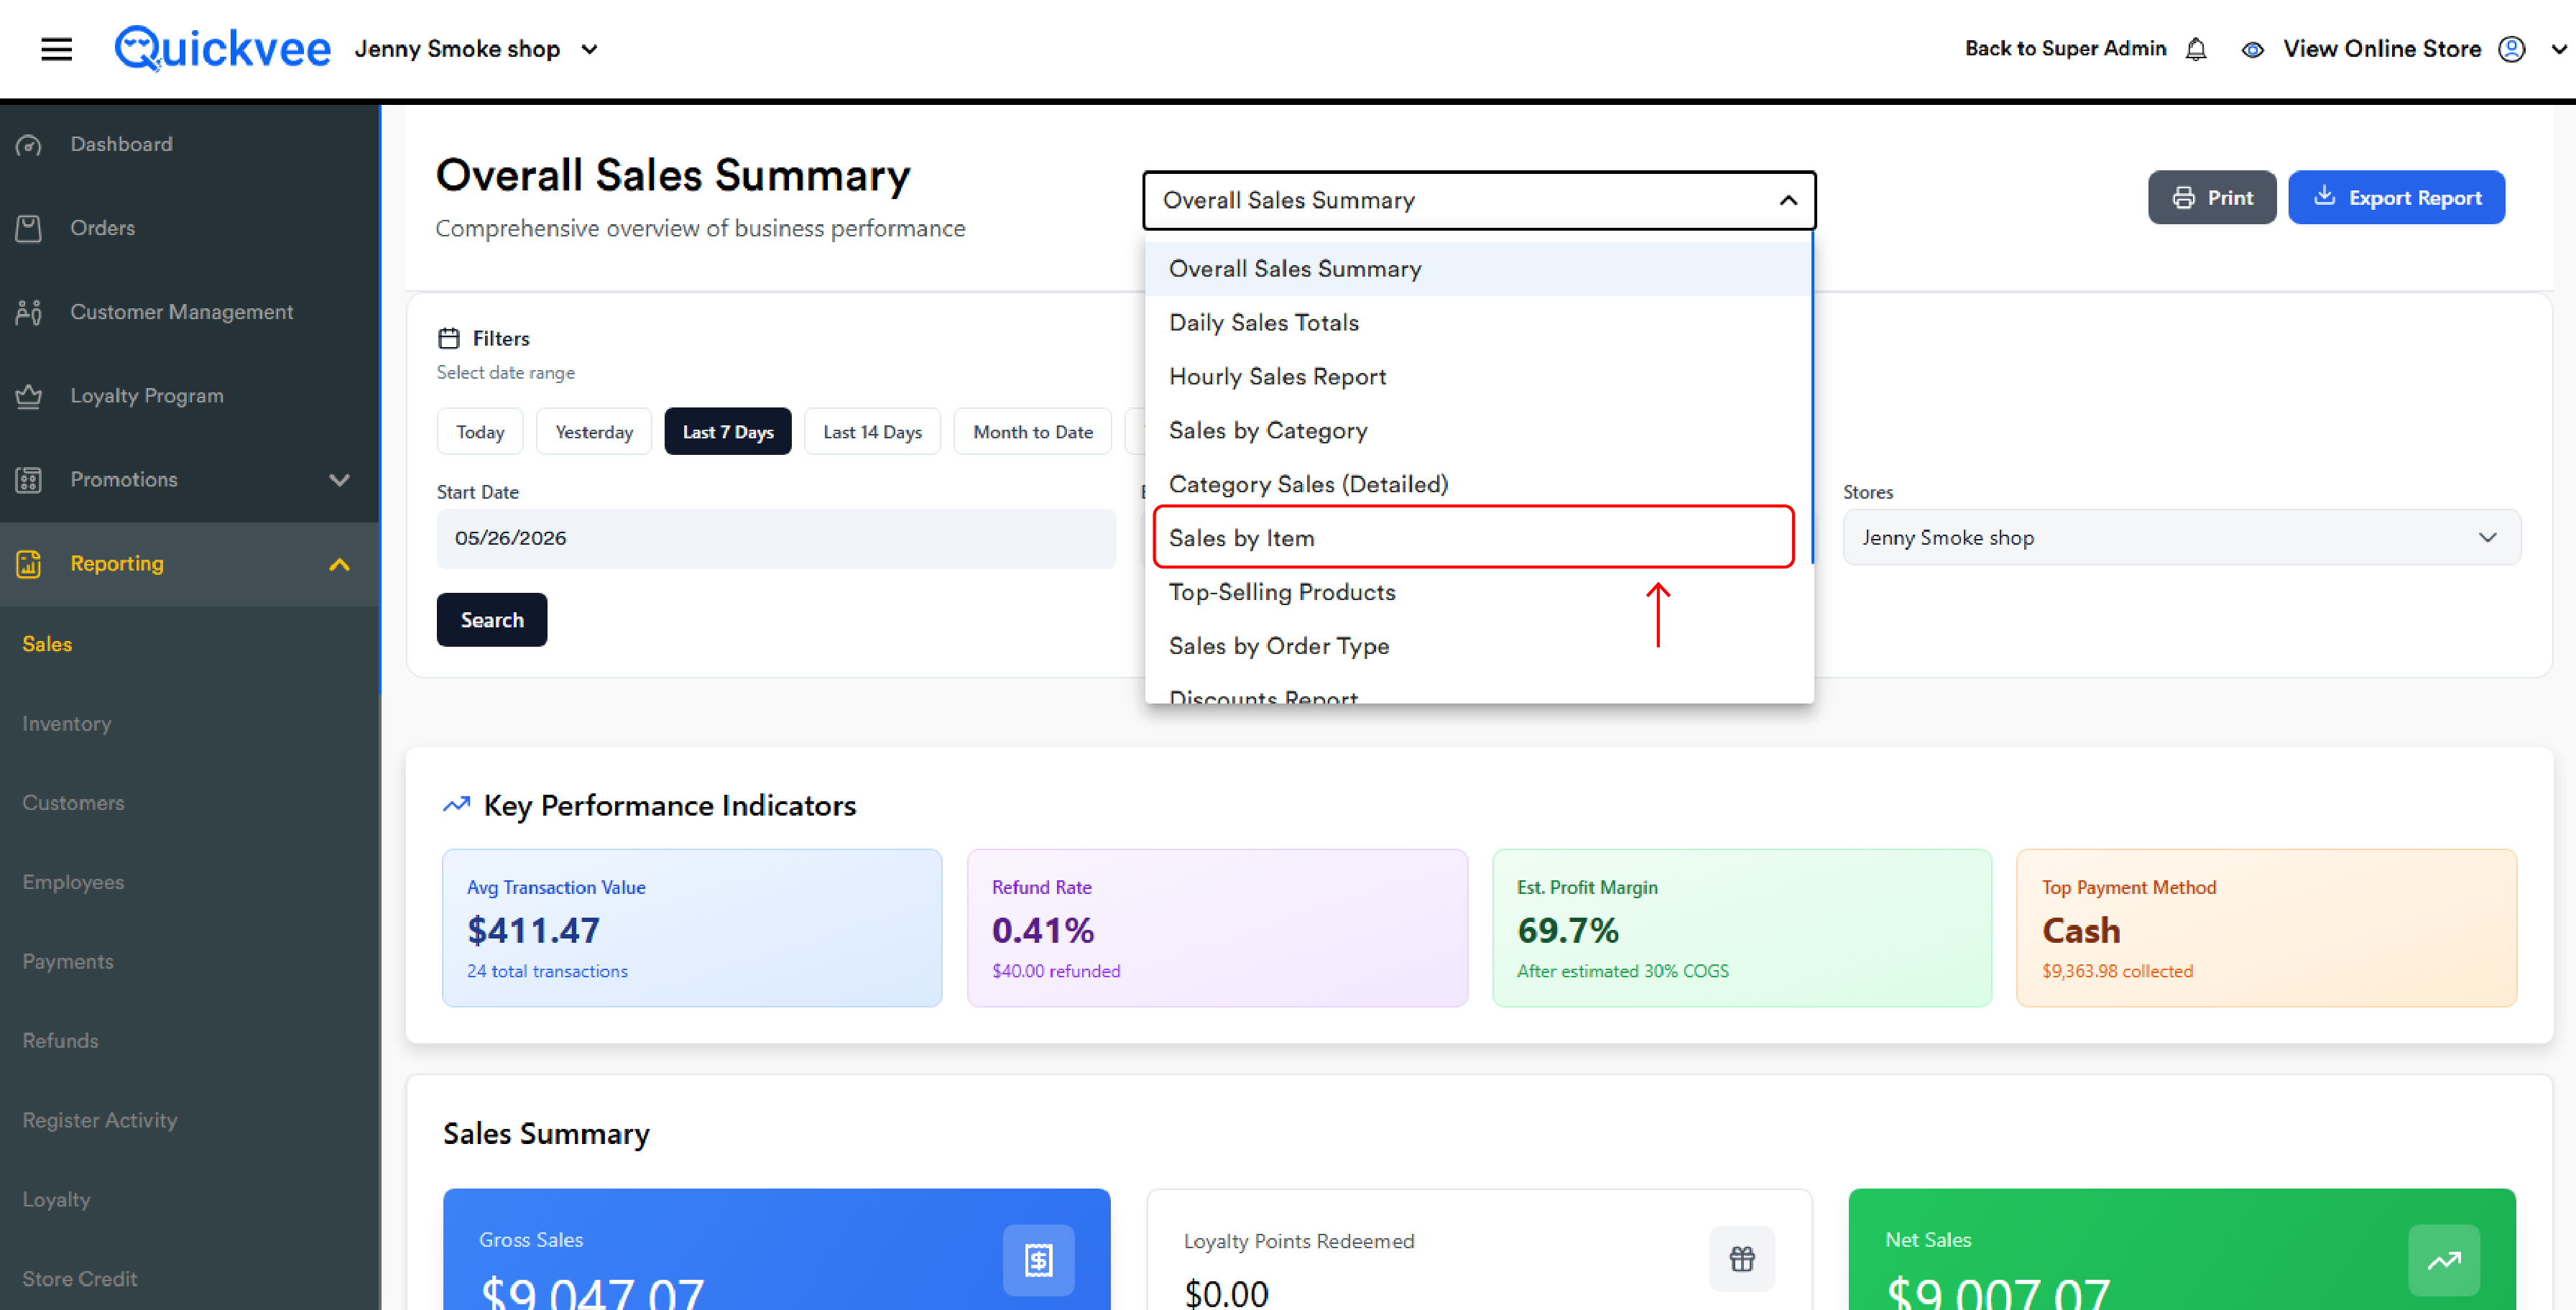
How this differs from related reports. Sales by Item lists every variant in a flat table. Top-Selling Products shows only the top N ranked items. Category Sales (Detailed) groups items into per-category cards and splits discounts into LP and Coupons columns. Use Sales by Item when you want to search, sort, and filter through every line item with brand and tag filters available.
The filter bar
Filters apply only after Search is tapped.
Filter by
-20260602-084144.jpg?cb=3b00606172b13780fe8d8898bcd33239)
Three independent multi-select dropdowns that narrow the table. They combine with AND logic — applying both Category: Disposables and Brand: Foger returns only Foger items in Disposables.
|
Filter |
Purpose |
|---|---|
|
Category |
Restrict to one or more product categories |
|
Brands |
Restrict to one or more brands assigned to products in the catalog |
|
Tags |
Restrict to one or more catalog tags (e.g. Featured, Clearance, New). Default is All |
Leaving each dropdown at its default returns every item sold in the range.
Date range
-
Quick filters — Today, Yesterday, Last 7 Days, Last 30 Days
-
Manual — pick a Start Date and End Date
Outlet
For multi-store accounts, the Outlet dropdown selects which location to report on.
Search & Export
-
Search — applies the current filters and reloads the summary cards and table
-
Export Report — useful for sharing item-level performance with vendors or staff
Summary cards
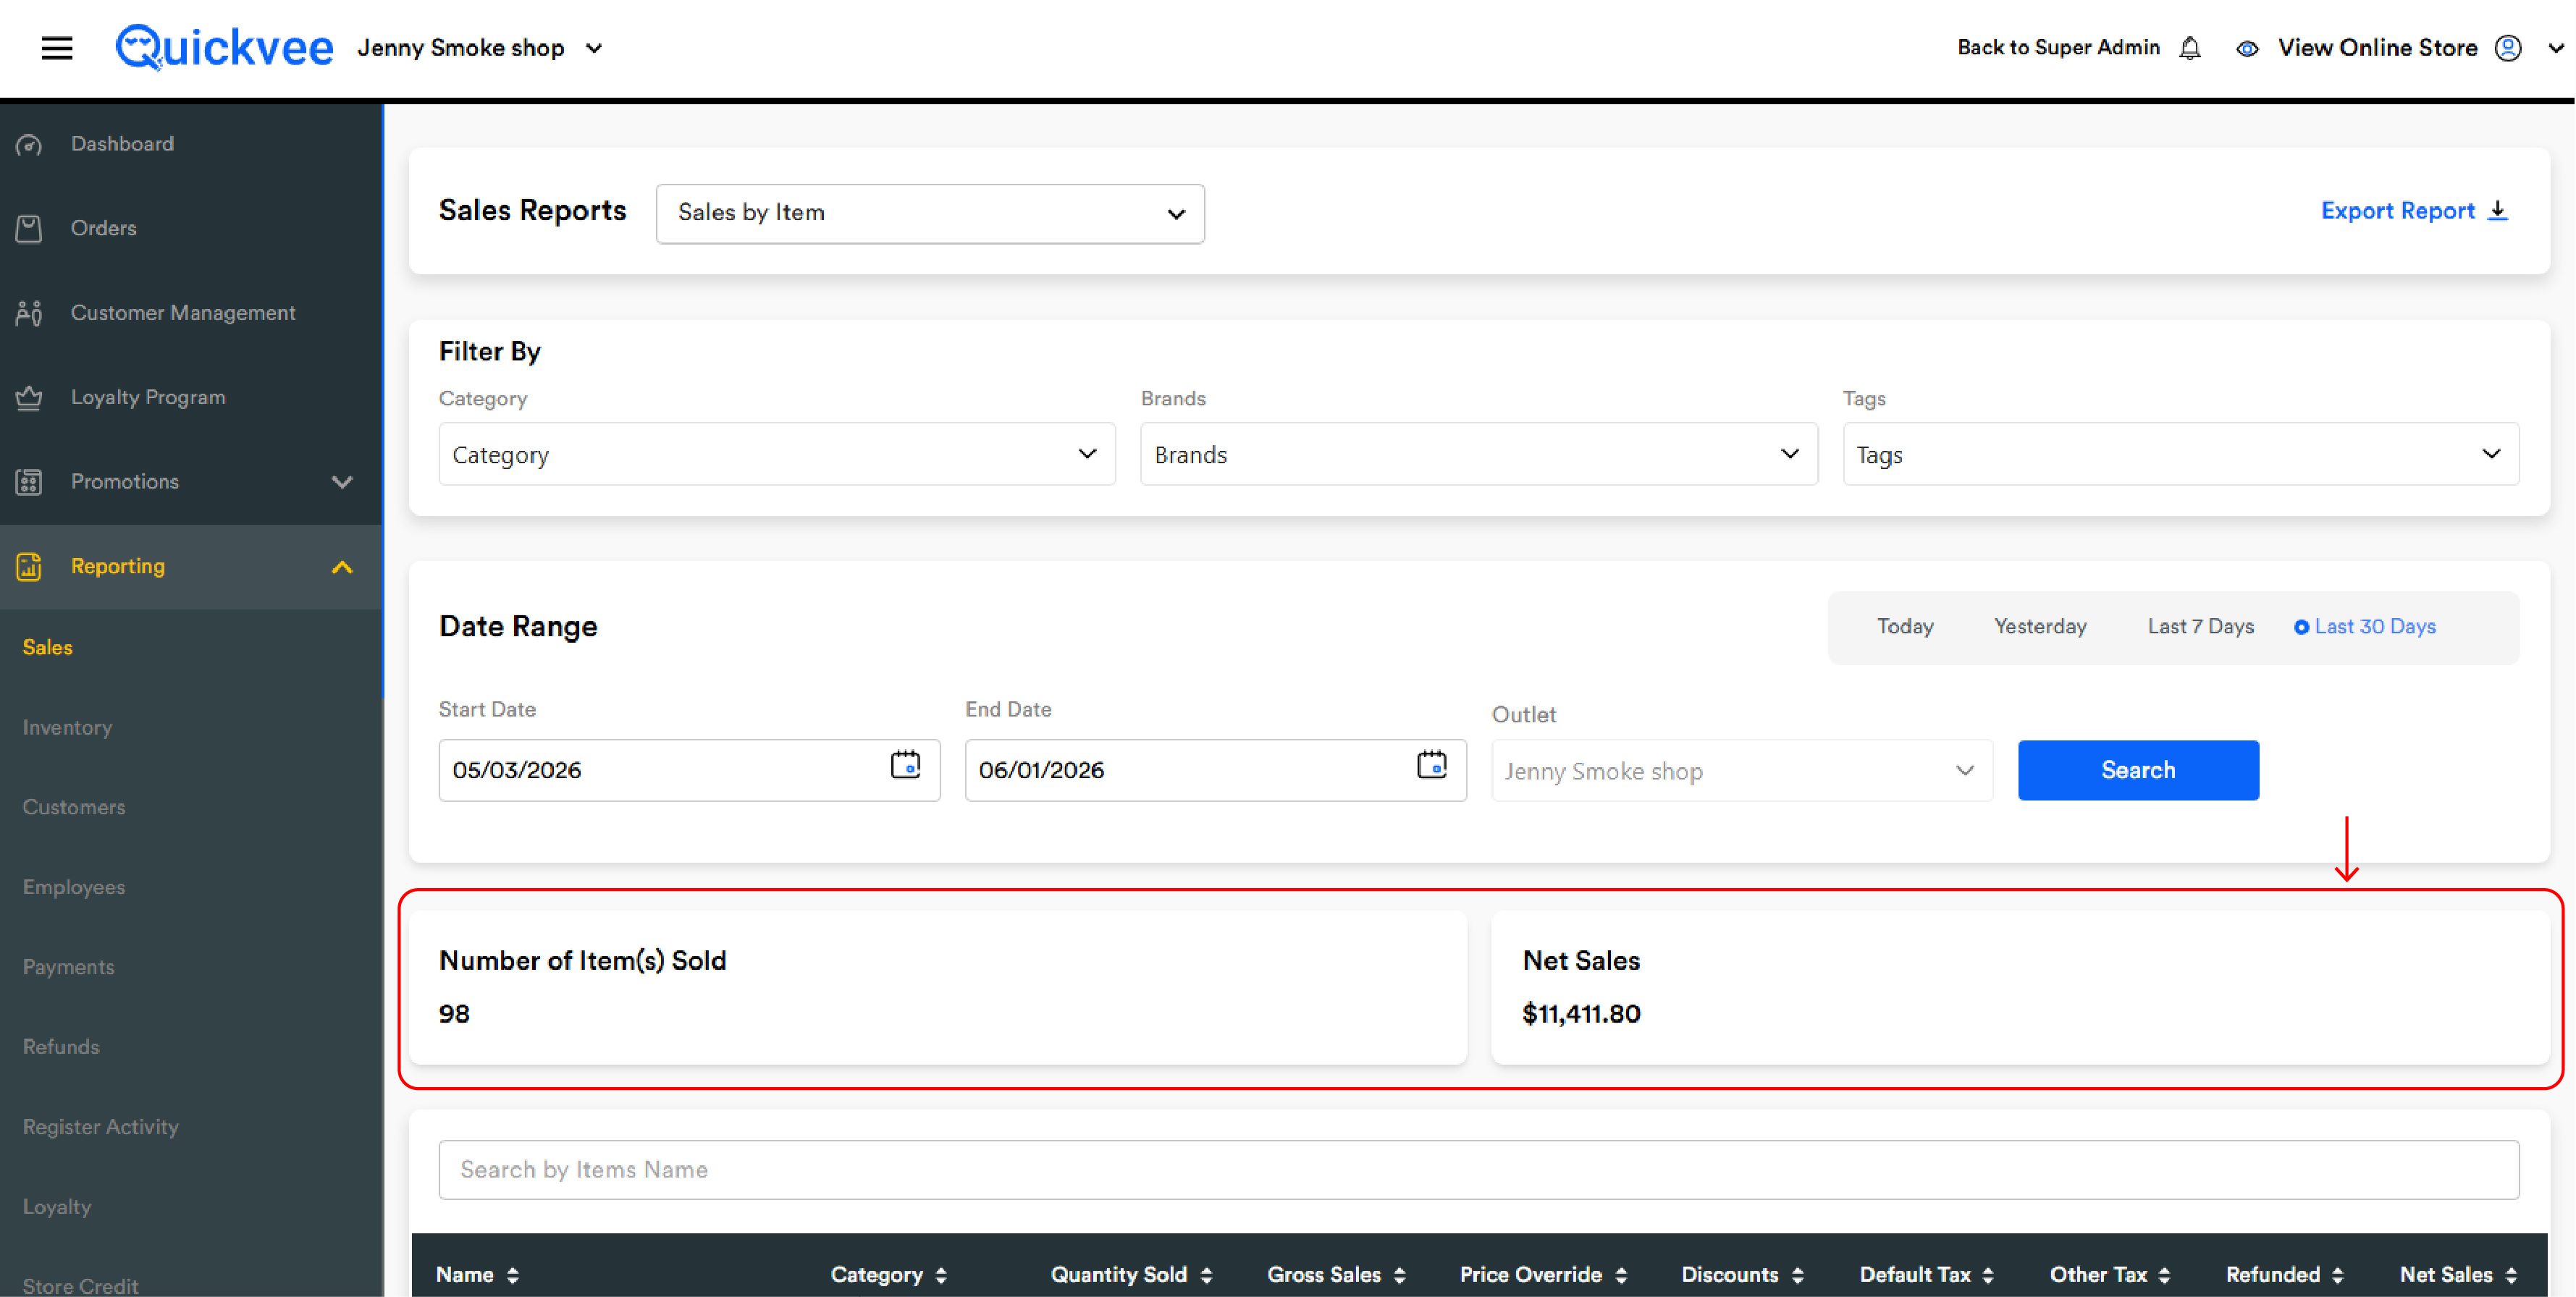
Two summary cards sit between the filter bar and the table — both reflect the currently filtered result, not the catalog as a whole.
|
Card |
What it shows |
|---|---|
|
Number of Item(s) Sold |
The total number of units sold across every row in the filtered table — the same as summing the Quantity Sold column |
|
Net Sales |
The total net sales across every row in the filtered table — the same as summing the Net Sales column |
These cards are the report's two headline numbers. Re-running the report with a brand filter shows that brand's contribution; re-running with a category filter shows that category's contribution.
Item search
Below the summary cards, a Search by Items Name field lets you type partial item names to filter the table in real time. This works in addition to the filter bar above — useful when you've already narrowed by brand or category and want to find one specific item within that filtered set.
The search does not require pressing Search again — it filters the rendered table as you type.
Reading the table
Ten columns, every column sortable — tap a header to flip ascending/descending.
-20260602-084235.jpg?cb=ed02d33c12011140a250d0da92afdfad)
|
Column |
What it shows |
|---|---|
|
Name |
The specific product variant — including flavor, size, or attribute. One row per variant |
|
Category |
The category assigned to the product. Custom items appear under Custom Category |
|
Quantity Sold |
Net units sold in the range (sales minus refunded units) |
|
Gross Sales |
Total dollar value of this item before any reductions — list price × quantity |
|
Price Override |
Dollars deducted via cashier-applied price override on this item |
|
Discounts |
Total dollars deducted via discounts of every type — custom discounts, loyalty points, coupons, BOGO, Mix N' Match, OTD — combined into one column |
|
Default Tax |
Dollars of tax collected under the primary/default tax rate |
|
Other Tax |
Dollars of tax collected under secondary tax rates (city, county, excise, etc.) |
|
Refunded |
Dollar value of refunds applied to this item in the range |
|
Net Sales |
Final revenue for this item after reductions: |
How the columns reconcile
A single line holds for each row:
Net Sales = Gross Sales − Price Override − Discounts − Refunded
Tax columns (Default Tax + Other Tax) are on top of the sale, not subtracted from it. The customer-paid total per item is Net Sales + Default Tax + Other Tax.
Common workflows
"How did one specific item sell yesterday?"
Quick filter → Yesterday → Search. Type the item name into the Search by Items Name field. The table narrows to matching rows.
"How is brand X performing this month?"
Set Filter By → Brands → select the brand → quick filter Last 30 Days → Search. The summary cards show the brand's total units and net sales. Sort the table by Net Sales descending to see the brand's top sellers.
"Which items are getting refunded most?"
Run the report for the desired period. Sort by Refunded descending. The top rows are items where money is being returned to customers.
"How are tag X items moving?"
Set Filter By → Tags → select the tag (e.g. Clearance) → Search. Read the summary cards for the tag's overall contribution. Sort by Quantity Sold descending to see which tagged items are moving and which aren't.
"Audit price overrides on a category"
Filter By → Category → select the category → Search. Sort by Price Override descending. The top rows are items where cashiers reduced the price most often. Cross-reference with the Discount Per Employee Report to find who applied them.
"What did the morning sell?"
Run for a single day. Use the Item Search to filter, or sort by Quantity Sold descending to see volume movers. Use the Hourly Sales Report to find which hour drove what total — Sales by Item does not slice by hour.
"Find slow-moving items in a category"
Filter By → Category → select → Search. Sort by Quantity Sold ascending. The top rows are the slowest-moving items in that category — candidates for clearance, removal, or repositioning.
Important notes
Only paid orders are included. Unpaid, voided, or cancelled orders are excluded. Refunds appear in the Refunded column and reduce Quantity Sold and Net Sales.
Variants are listed separately. A parent product with three flavors that all sold in the range appears as three rows — not one row. To consolidate to the parent, export and aggregate in Excel.
The Discounts column combines all discount types. Loyalty points, coupons, custom discounts, BOGO, Mix N' Match, and OTD are all summed into the single Discounts column. For a per-discount-type breakdown, use the Category Sales (Detailed) report (which splits LP Discounts and Coupons Discounts into separate columns) or the Discounts Report.
Custom items appear with Custom Category. Items keyed in at the register as custom appear with their assigned Custom Category label and contribute fully to the report — they are real sales.
Deleted catalog items still appear if they sold in the range. Removing a product from the catalog after it sold does not remove its historical sales from this report. The Category column may display the last-known category.
Filters do not auto-apply, except for the item-name search. Changing Category, Brands, Tags, dates, or Outlet requires tapping Search. The item-name search field filters as you type.
The summary cards update with filters. Number of Items Sold and Net Sales always reflect the currently filtered table. Clearing all filters returns the cards to the period's full totals.
Net Sales is pre-tax. Customer-paid total per item is Net Sales + Default Tax + Other Tax. For end-of-day reconciliation that matches till close, use Daily Sales Totals.
Price Override is separate from Discounts. A cashier marking a single line item down to a custom price lands in Price Override. A cashier applying a 10% discount to the same item lands in Discounts. They are not double-counted.