
The Sales by Item per Employee report is your line-by-line product attribution view. It answers "which products did each cashier ring up, and what were they worth?" — broken down to the SKU level, with quantity, gross sales, cost, discount, net sales, margin %, and gross profit on every product, for every employee, across whatever date range and outlet you choose.
Use it for commission and bonus calculations tied to specific high-margin categories, for identifying which cashiers move which products, for spotting accidental discounts or comp-outs, and for verifying that a given product is selling through the team you expect.
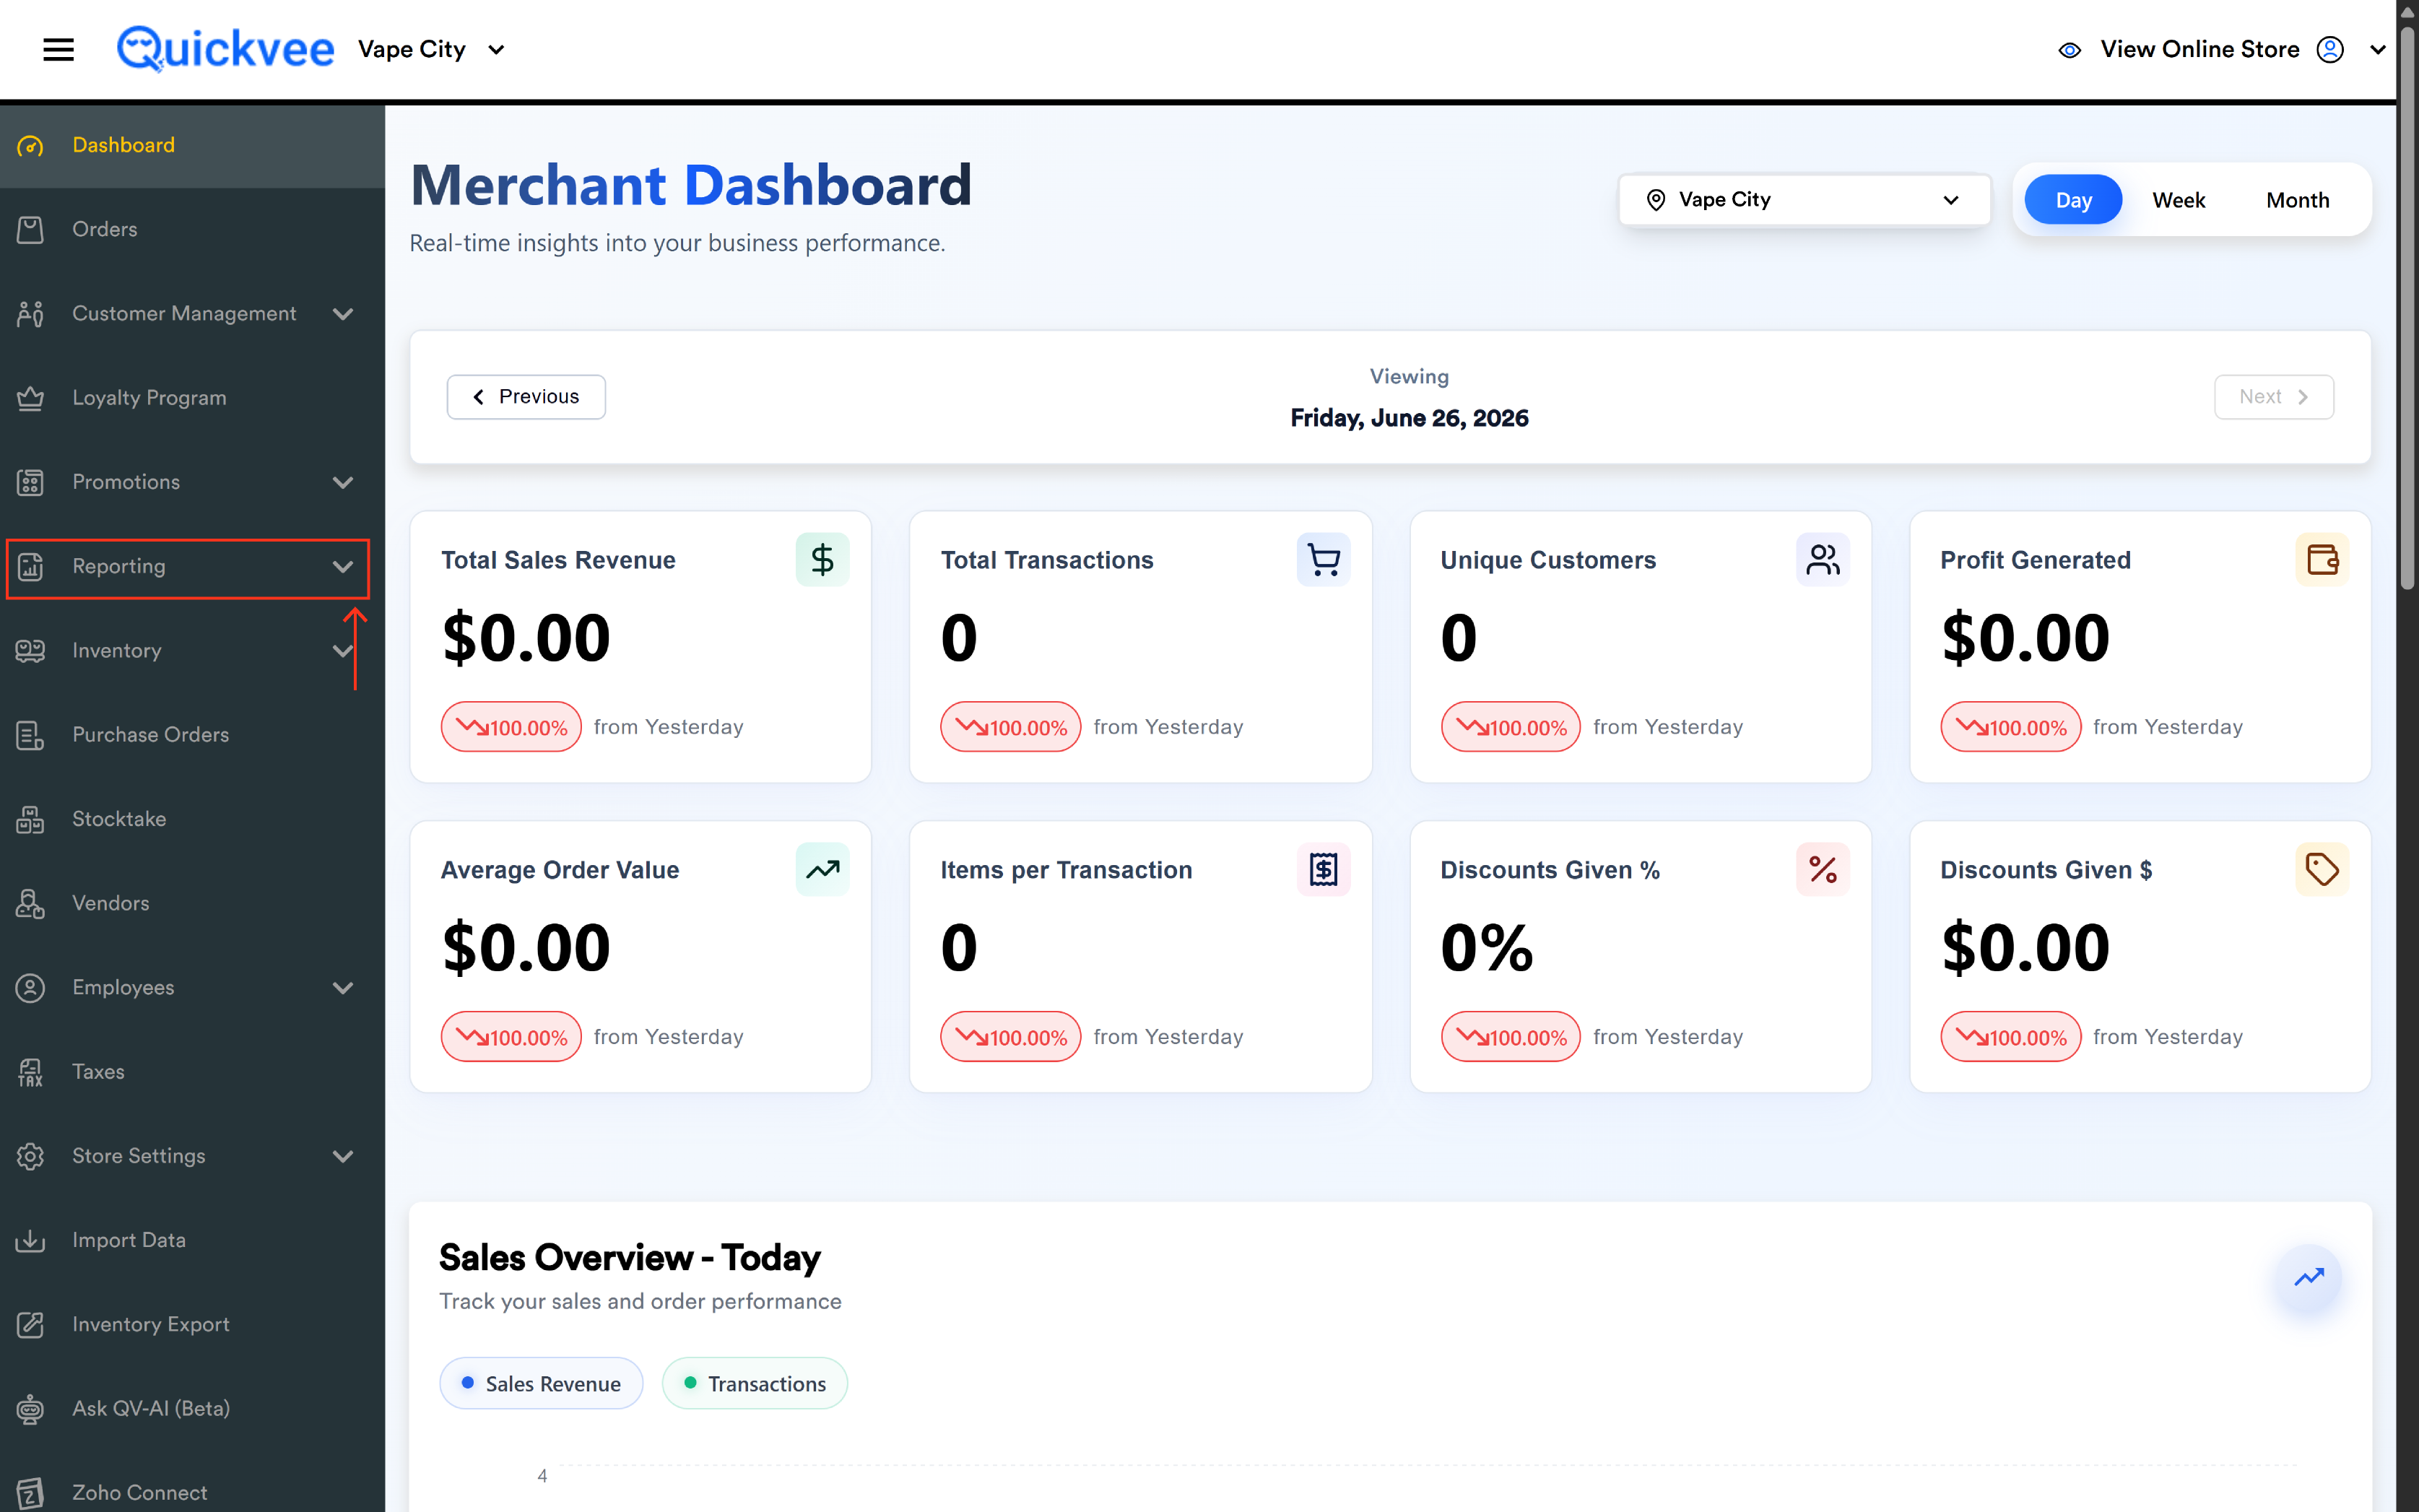
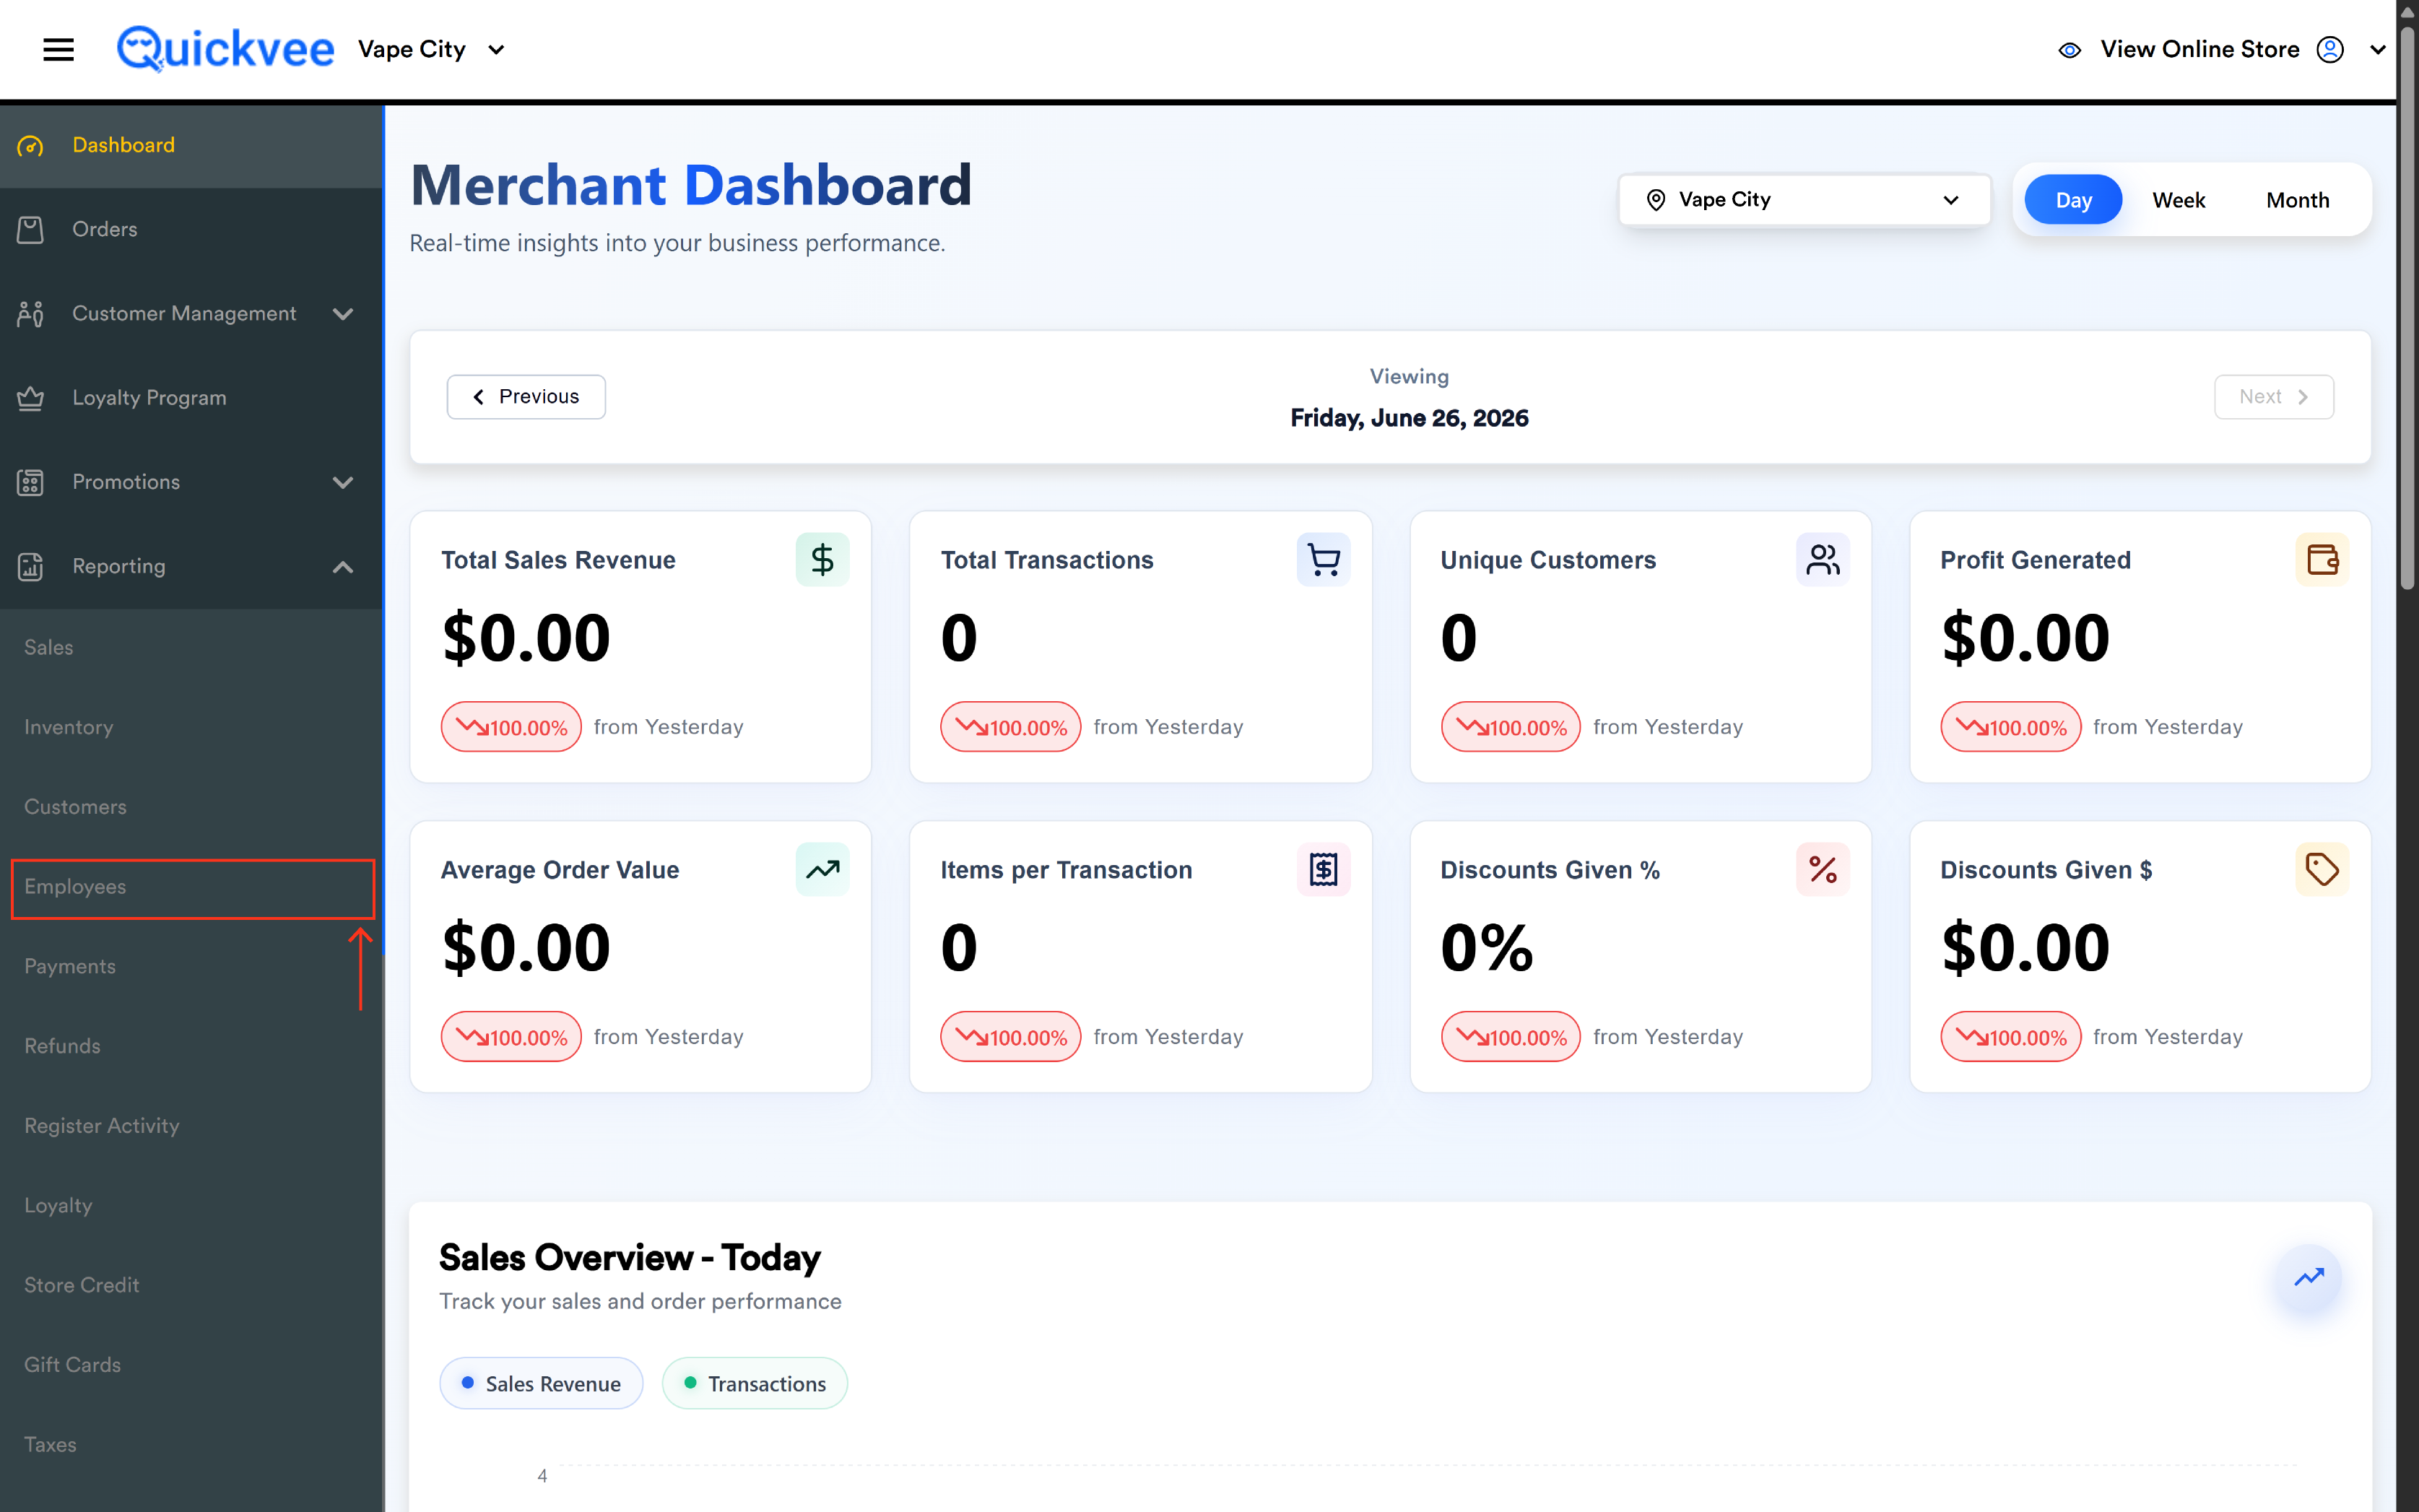
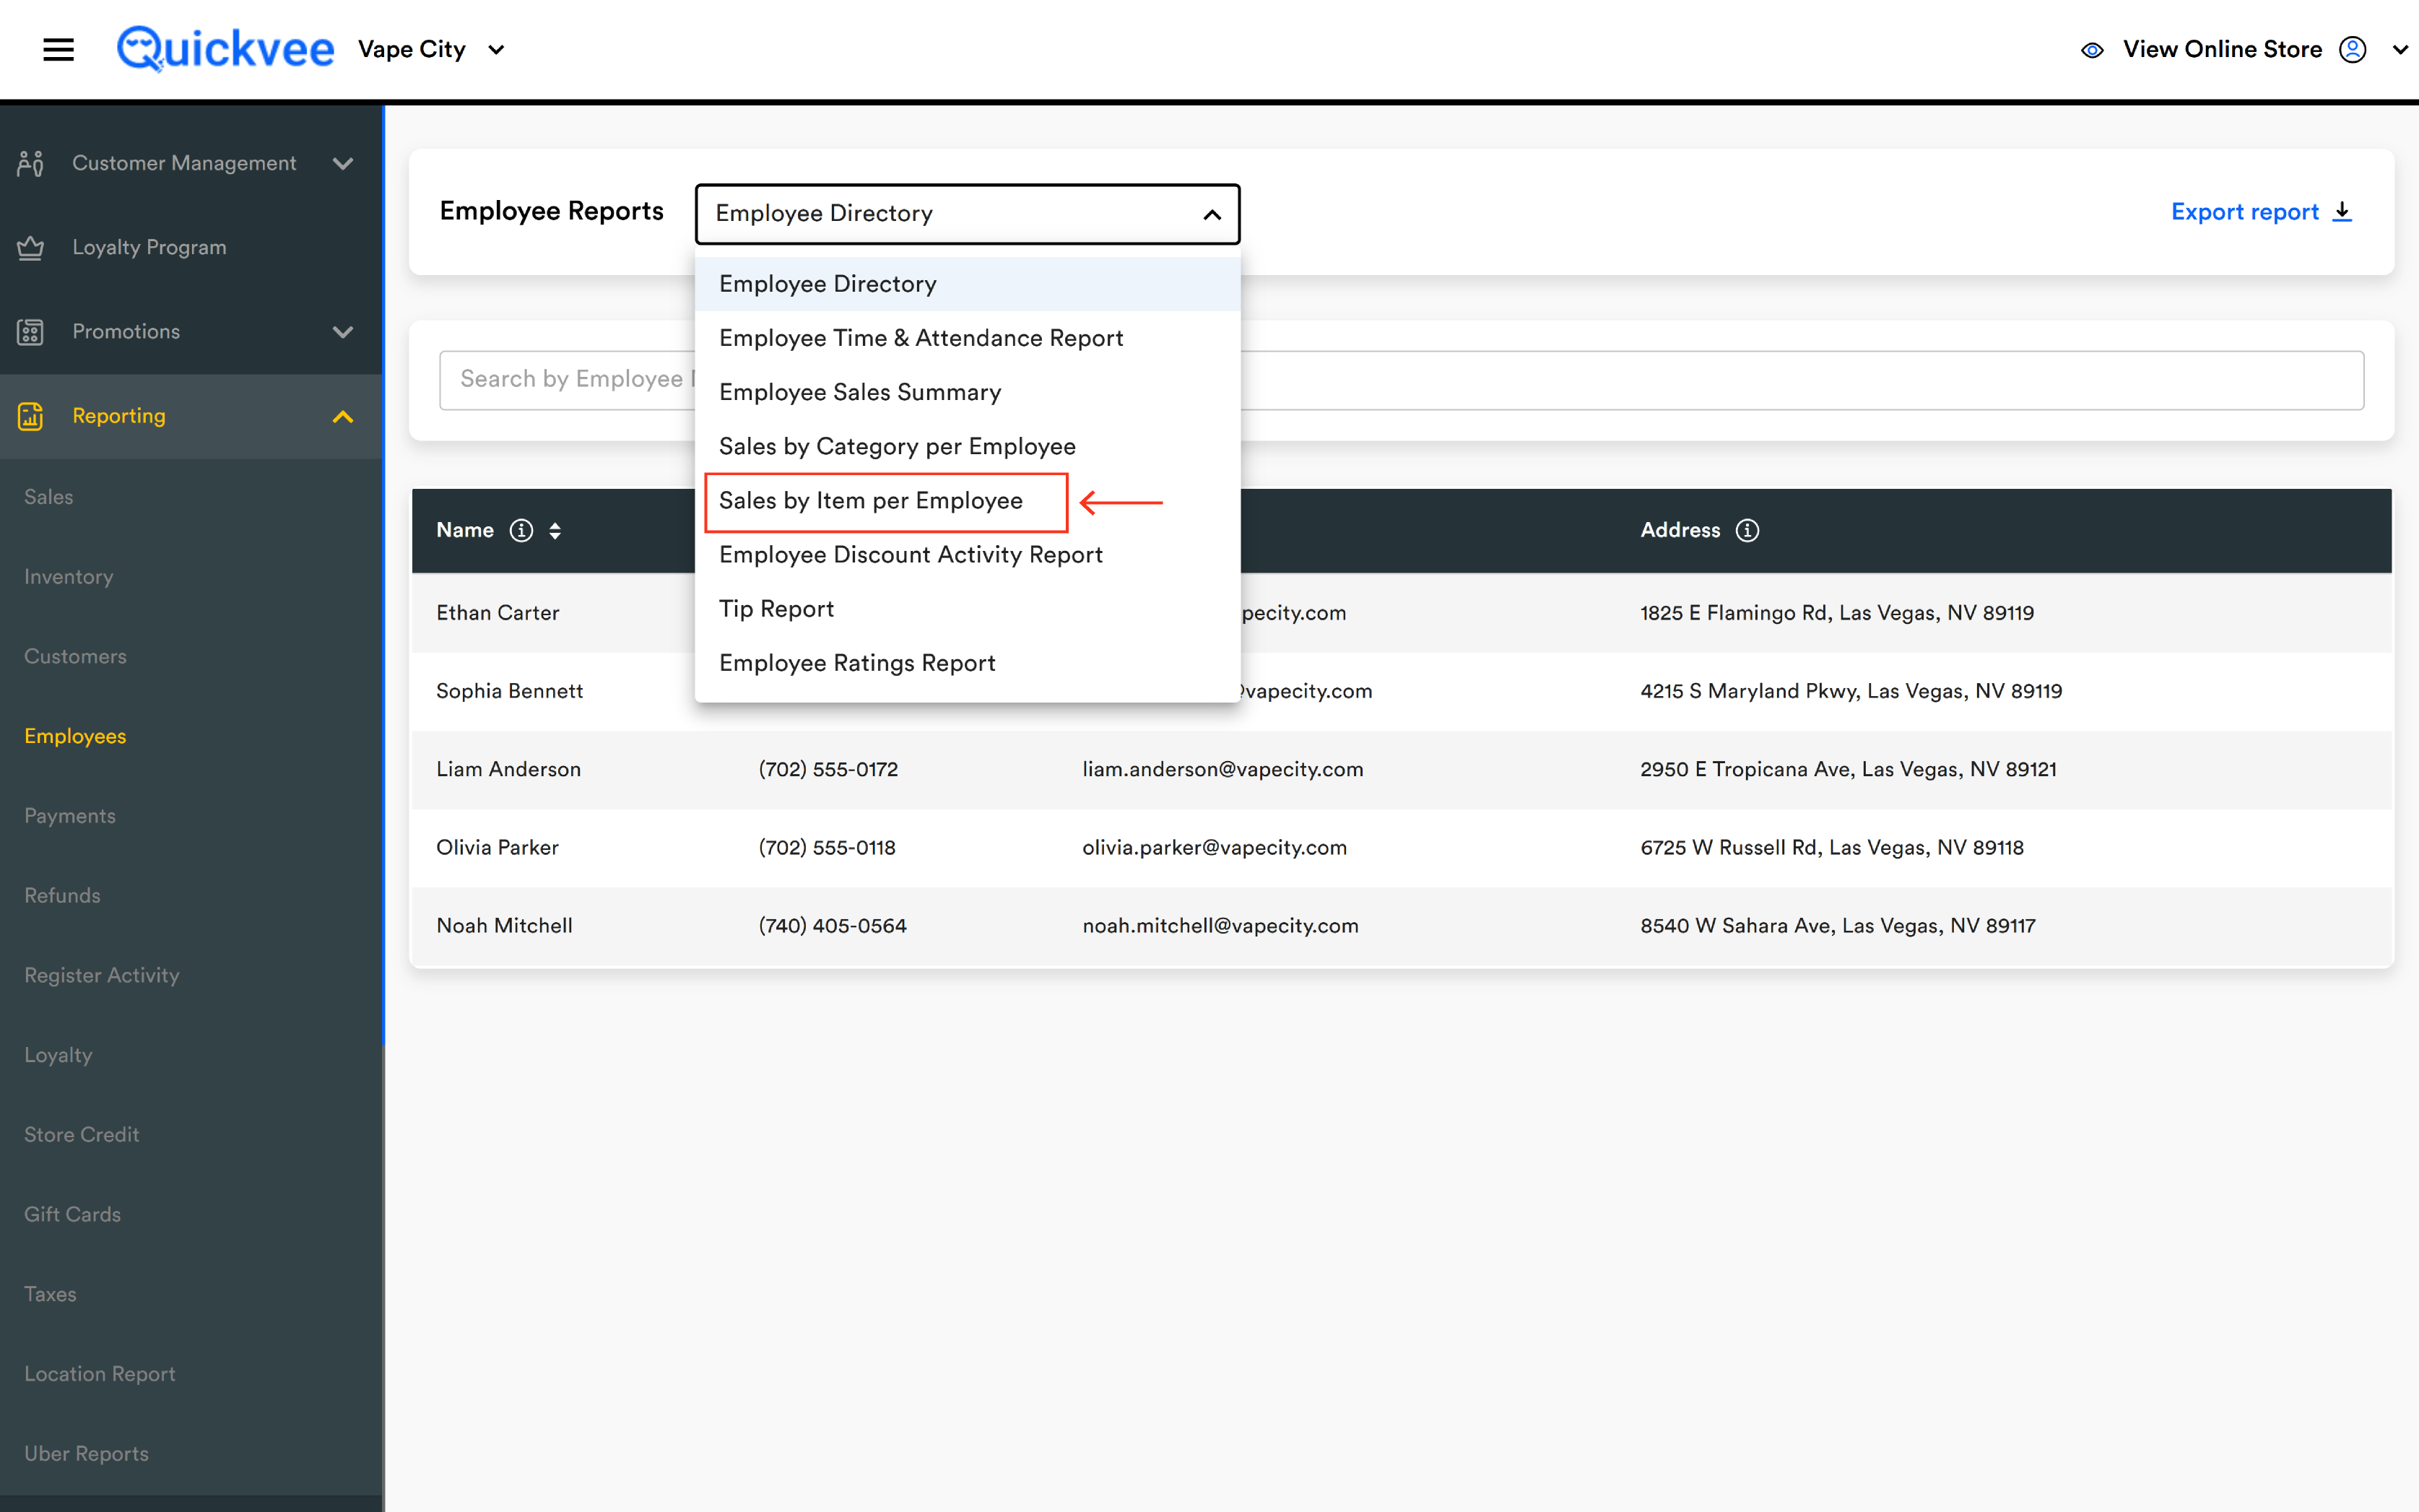
Access path: Sign in to your merchant backend → side menu → Reporting → Employees → and from the Employee Reports dropdown at the top of the page select Sales by Item per Employee.
Running the report
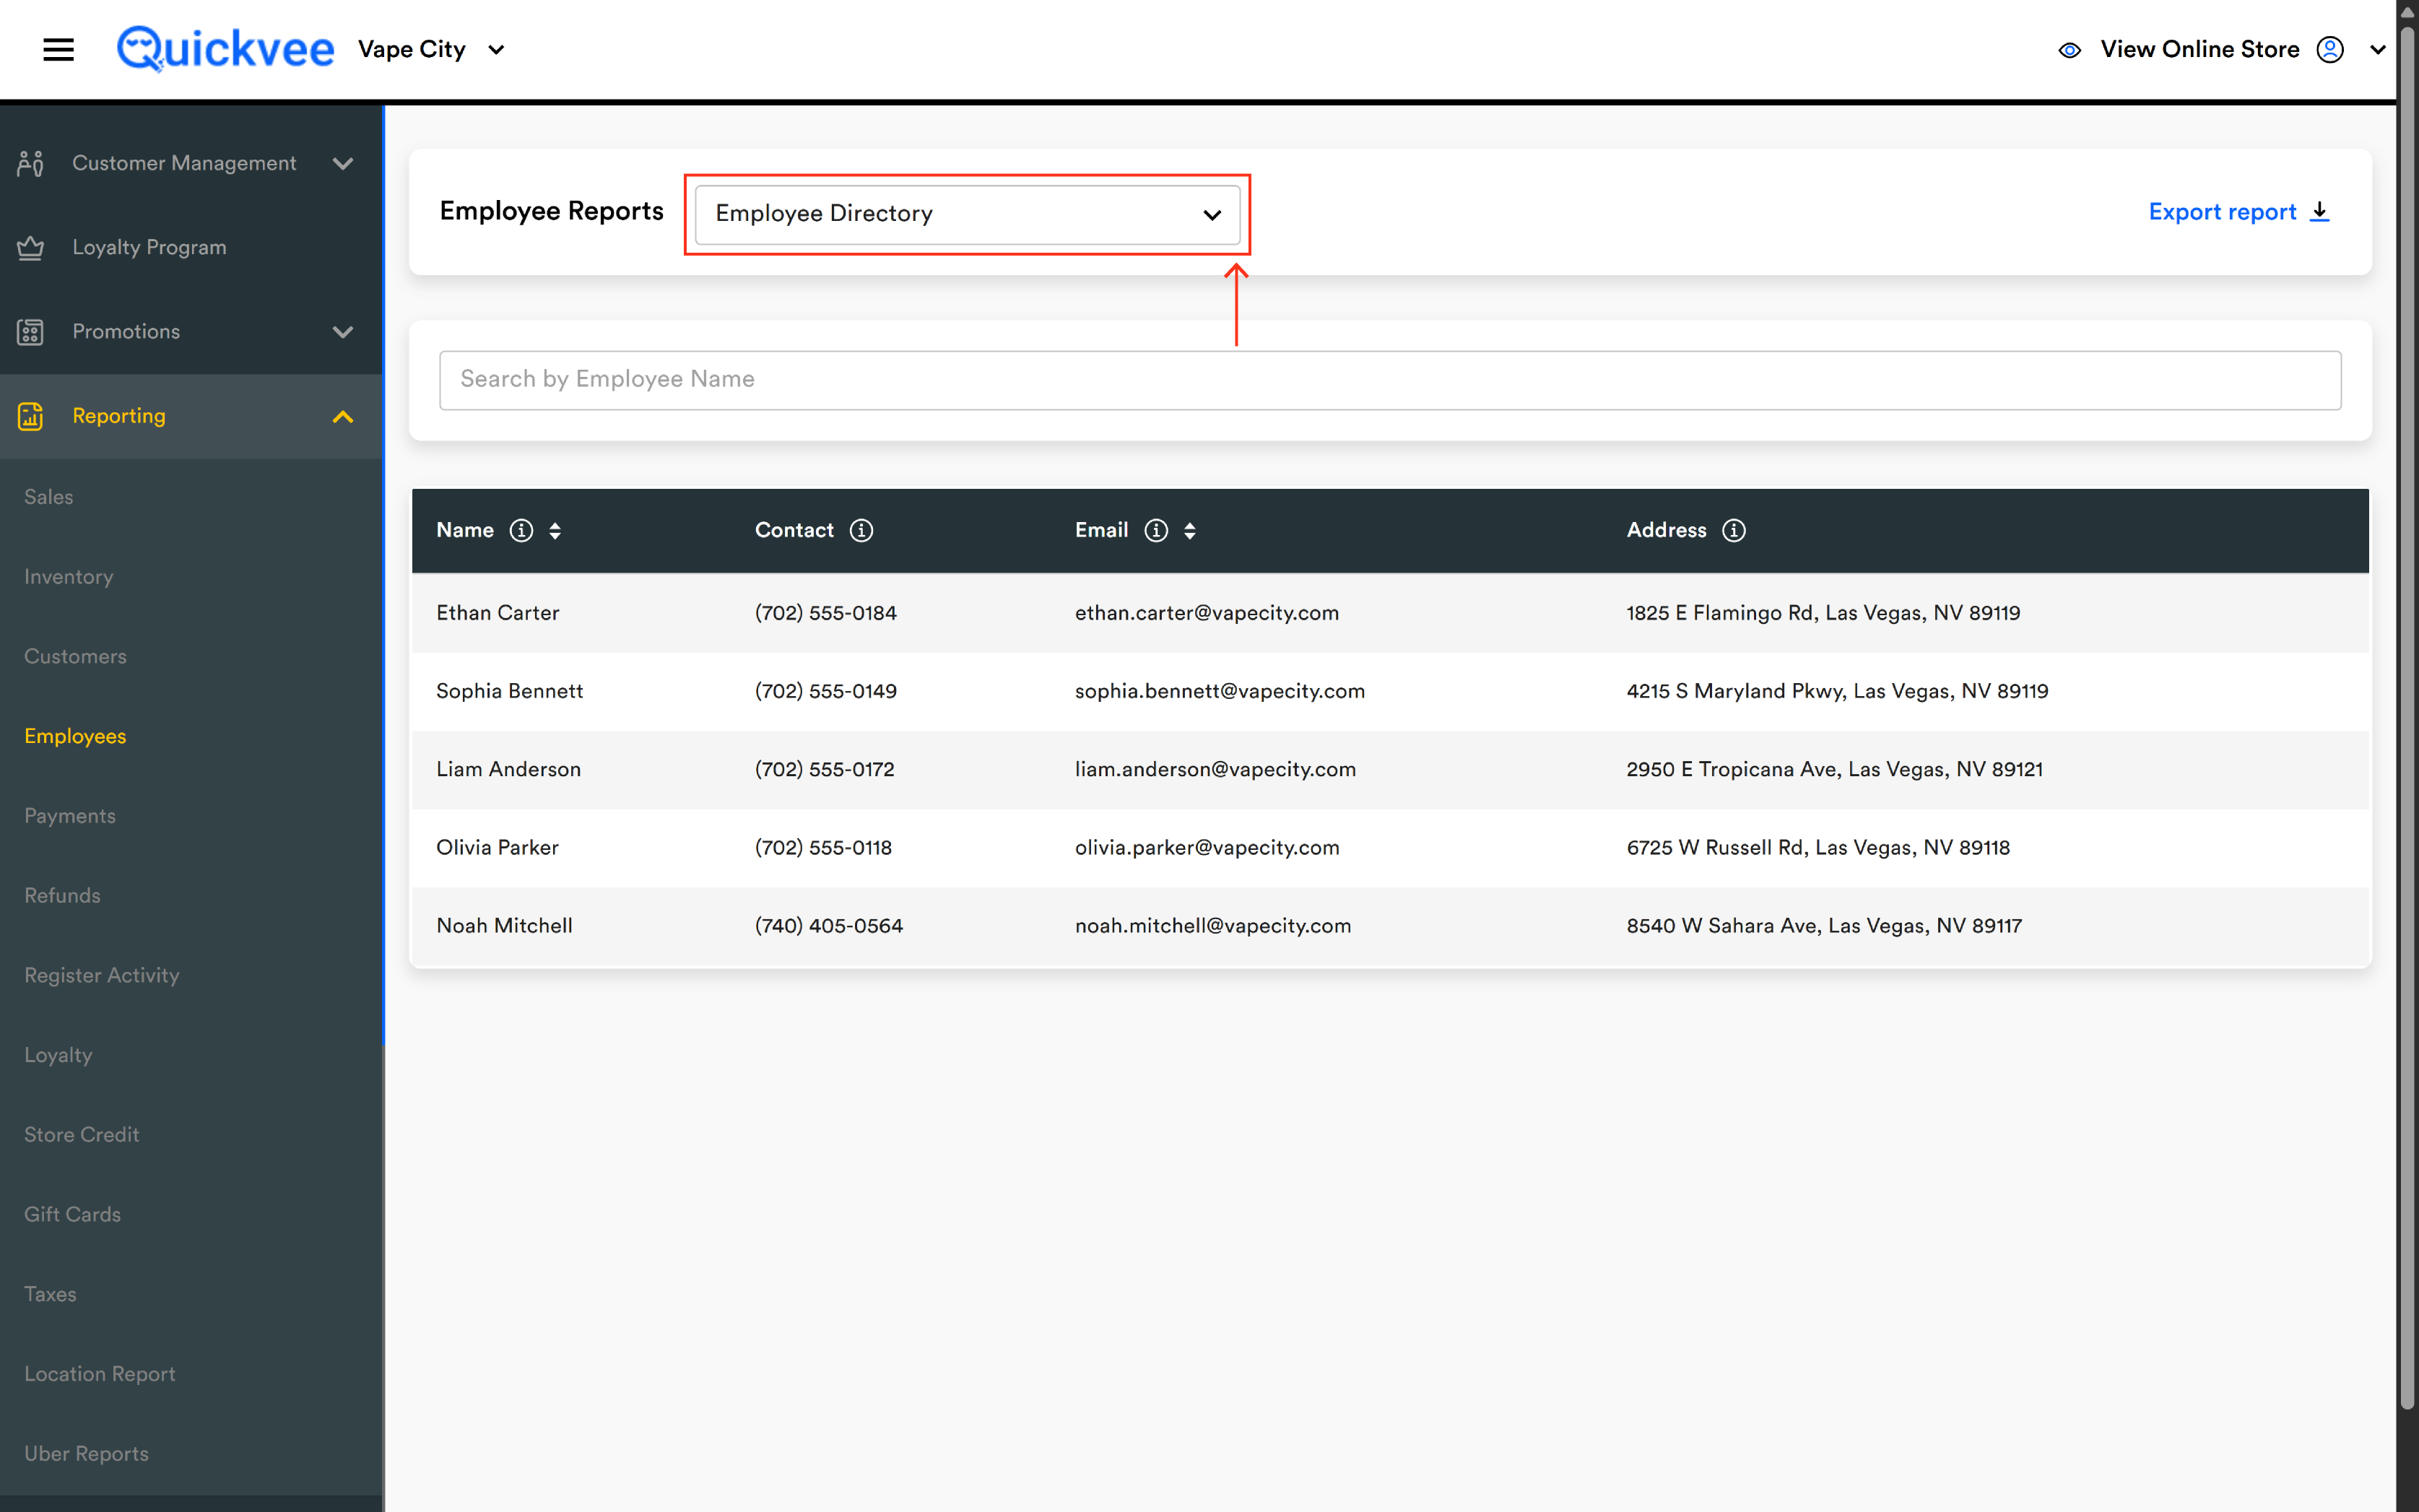
The Employee Reports dropdown
The dropdown labeled Employee Reports lets you switch between the available employee-level reports without leaving the page. Sales by Item per Employee is one of several options — pick it to load this report.
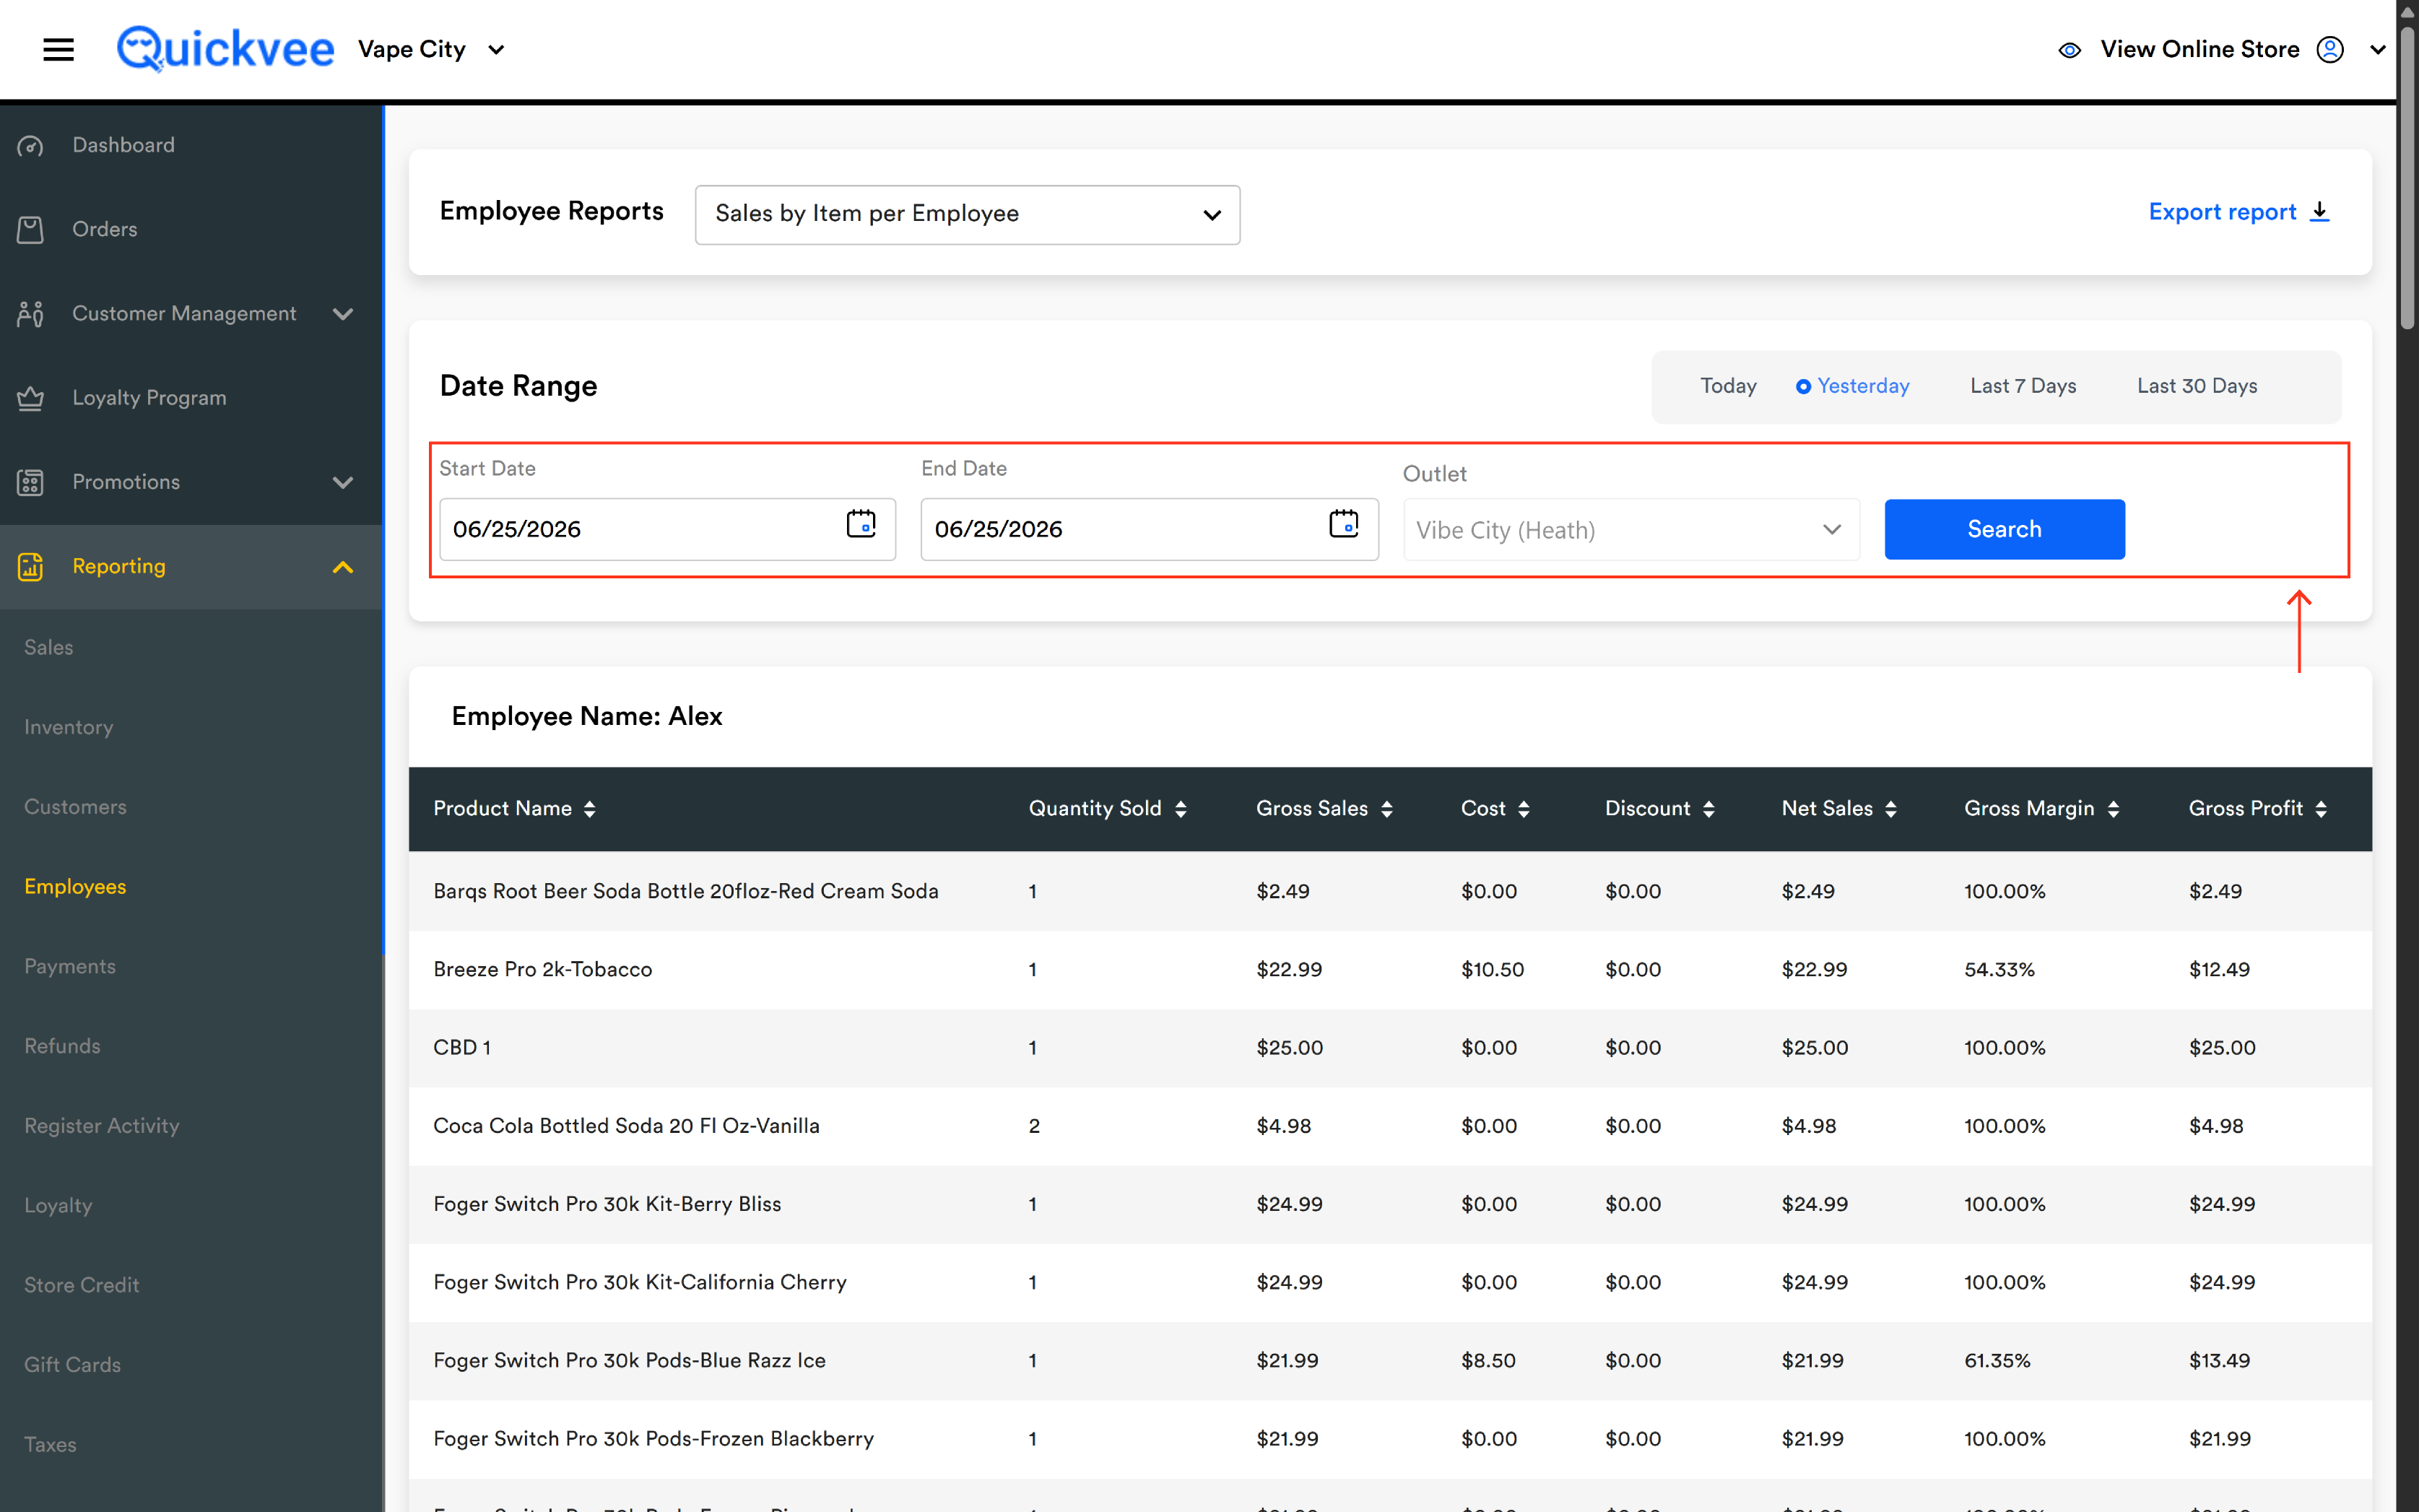
Date Range section
|
Control |
What it does |
|---|---|
|
Start Date |
The first day of the date range. Calendar picker. |
|
End Date |
The last day of the date range. Calendar picker. |
|
Outlet |
When your account has more than one store location, the outlet dropdown picks which store the report runs against. Defaults to your current outlet. |
|
Search (blue) |
Runs the report against the selected date range and outlet. |
Quick range buttons
To the right of the Date Range section, four buttons let you skip the calendar picker: Today, Yesterday, Last 7 Days, Last 30 Days.
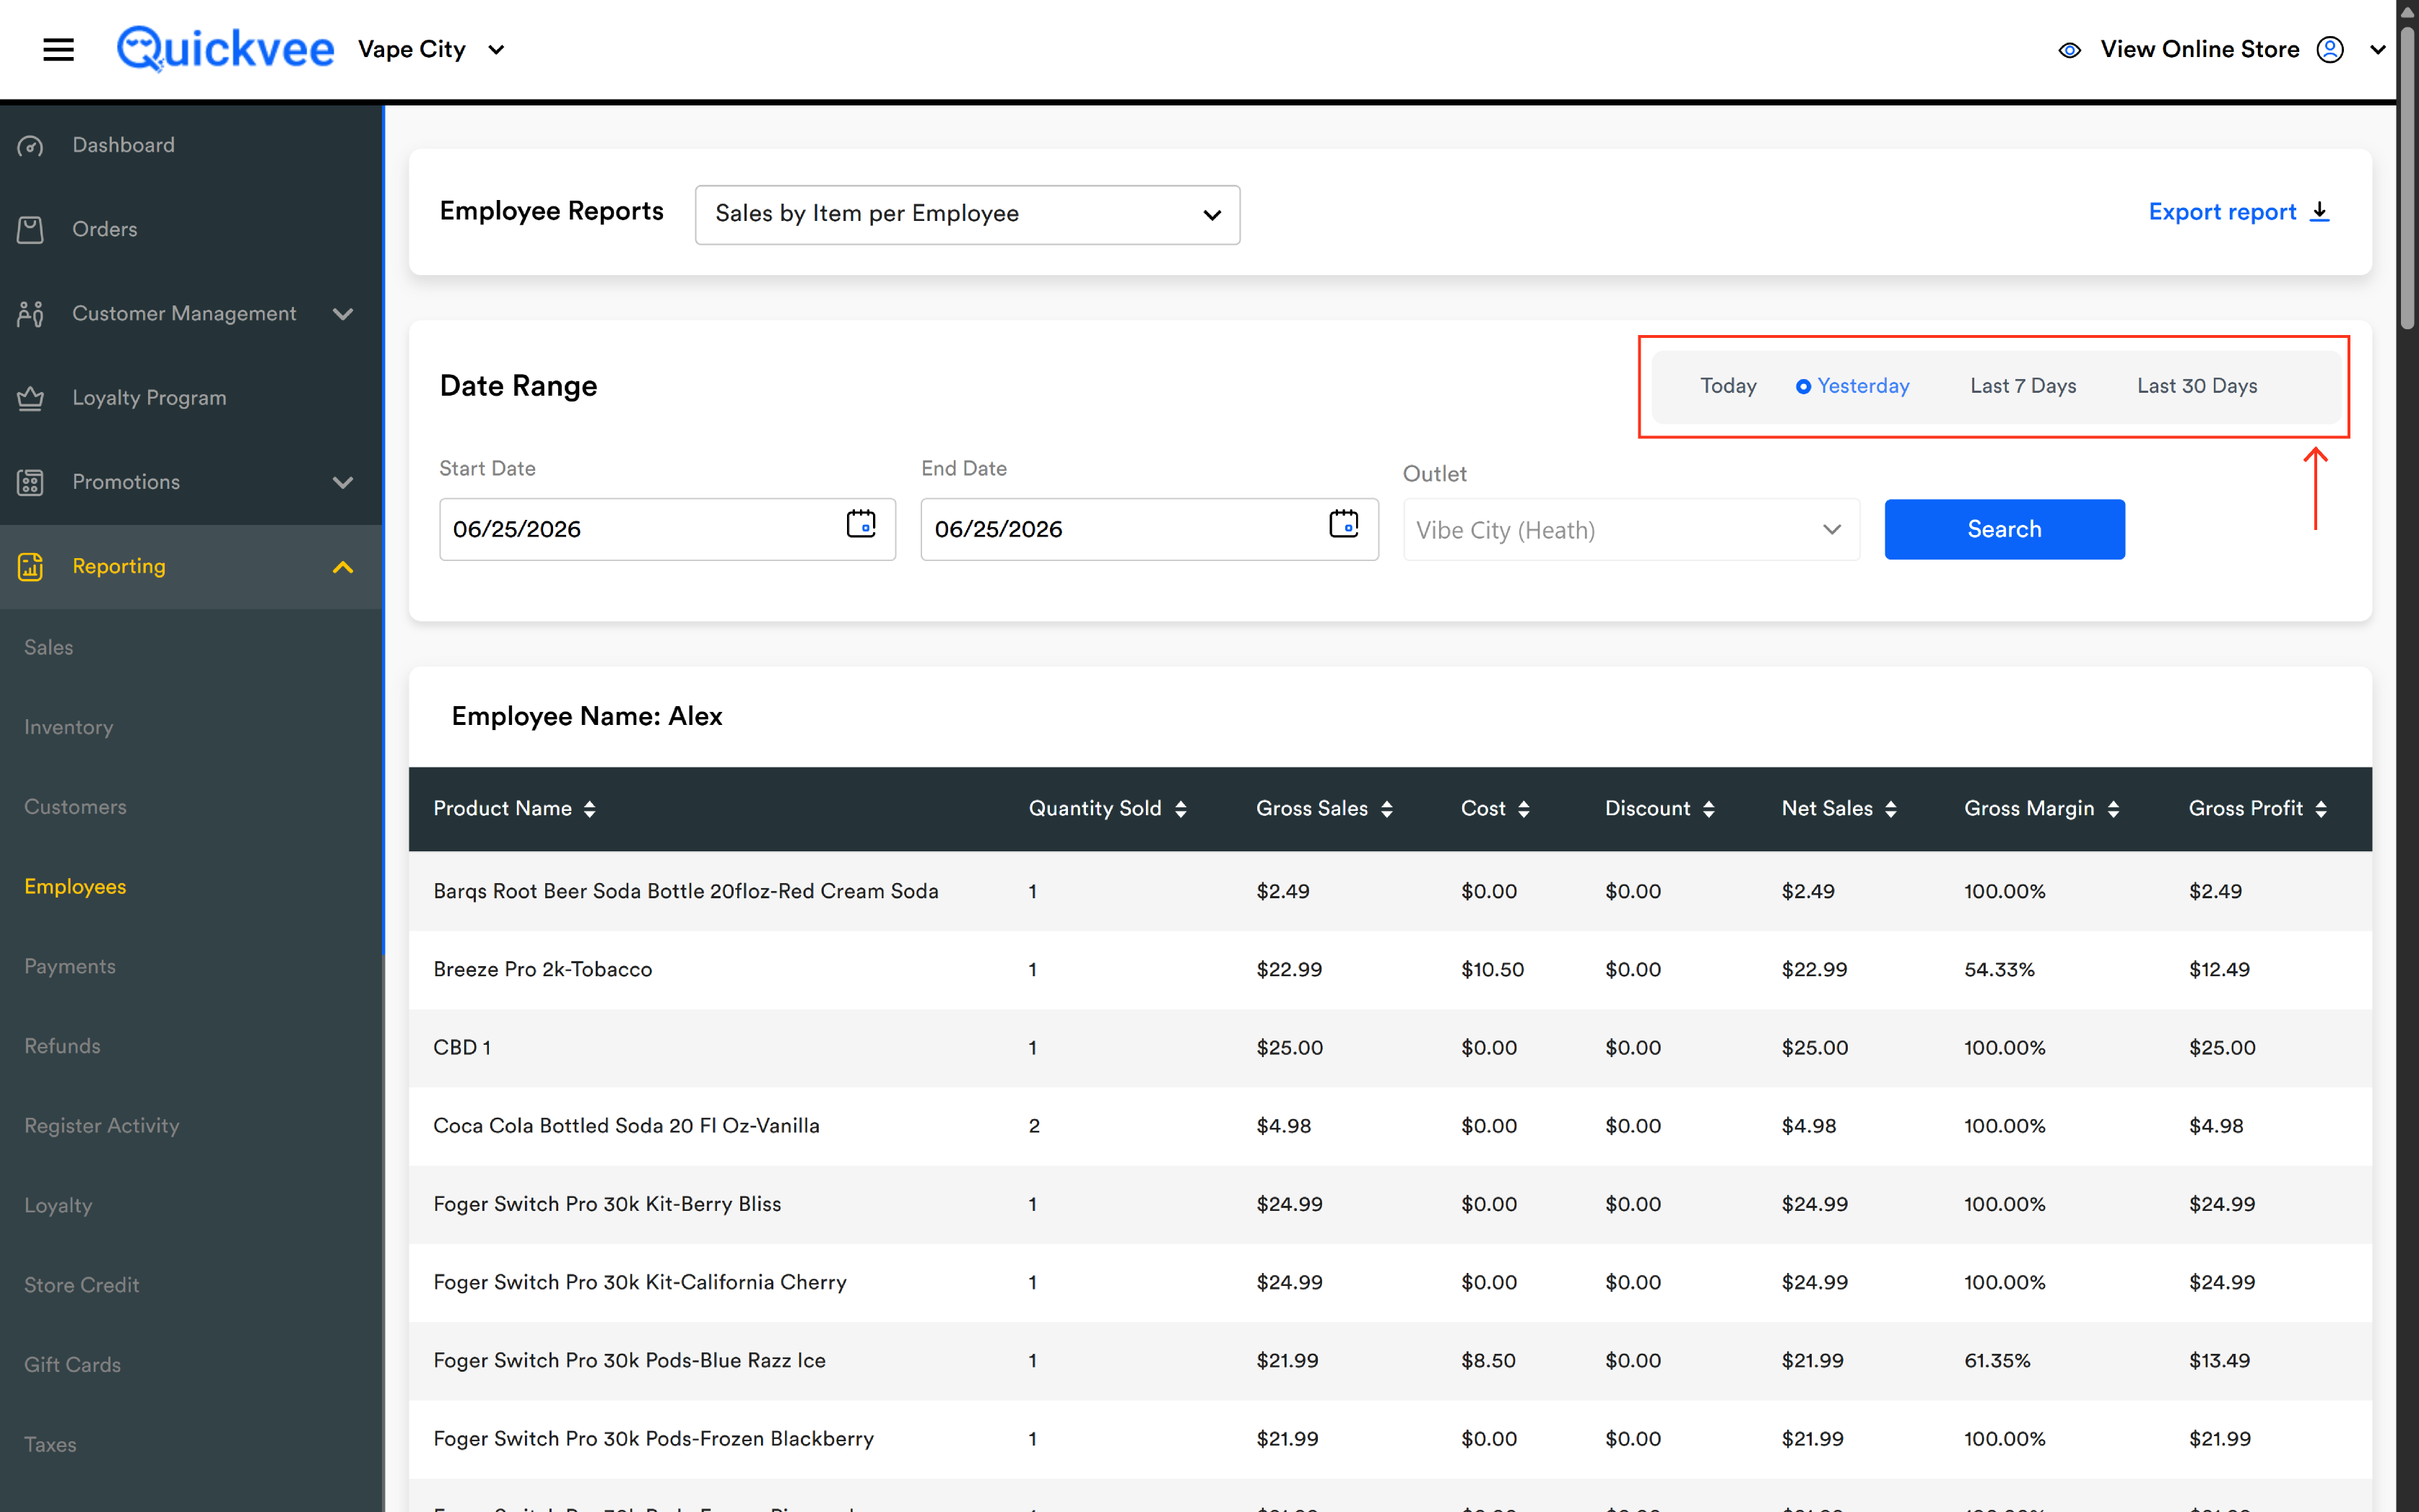
Tip: Pick Yesterday for end-of-day commission close-outs. Pick Last 7 Days or Last 30 Days for pay-period reviews.
Export report
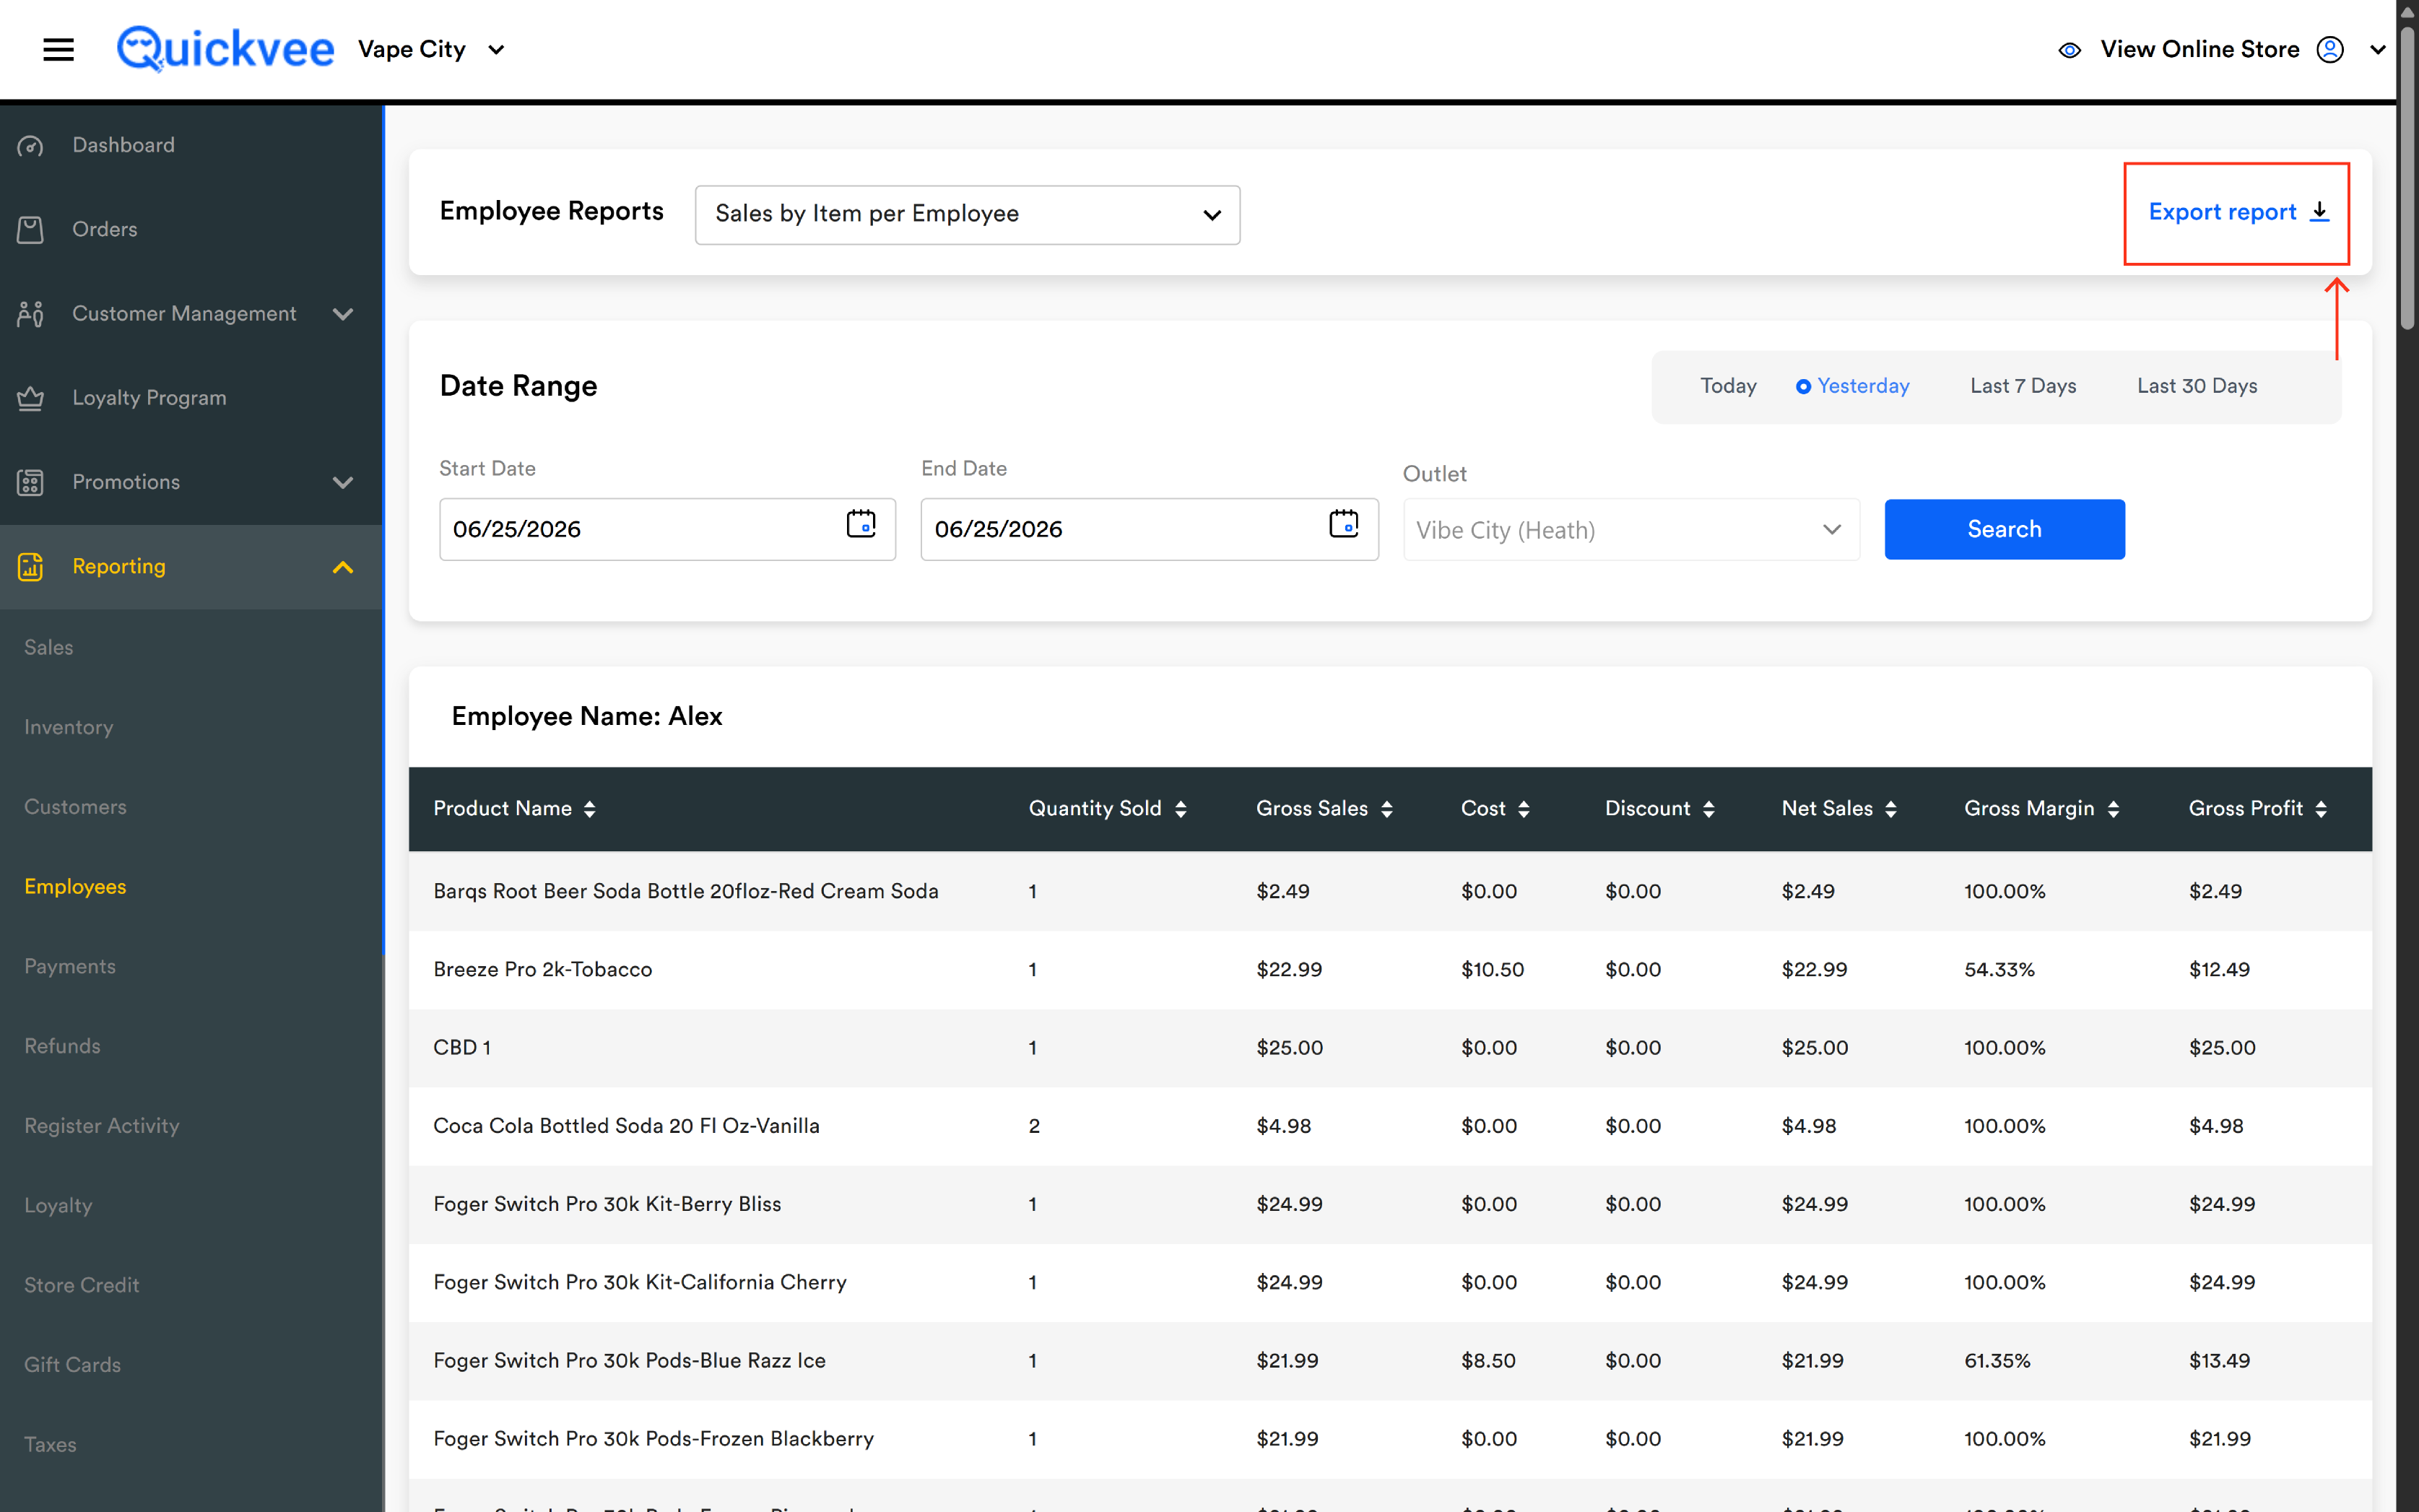
The Export report link at the top-right downloads the full report — every employee block and every product row — as a spreadsheet you can open in Excel or Google Sheets.
Reading the report
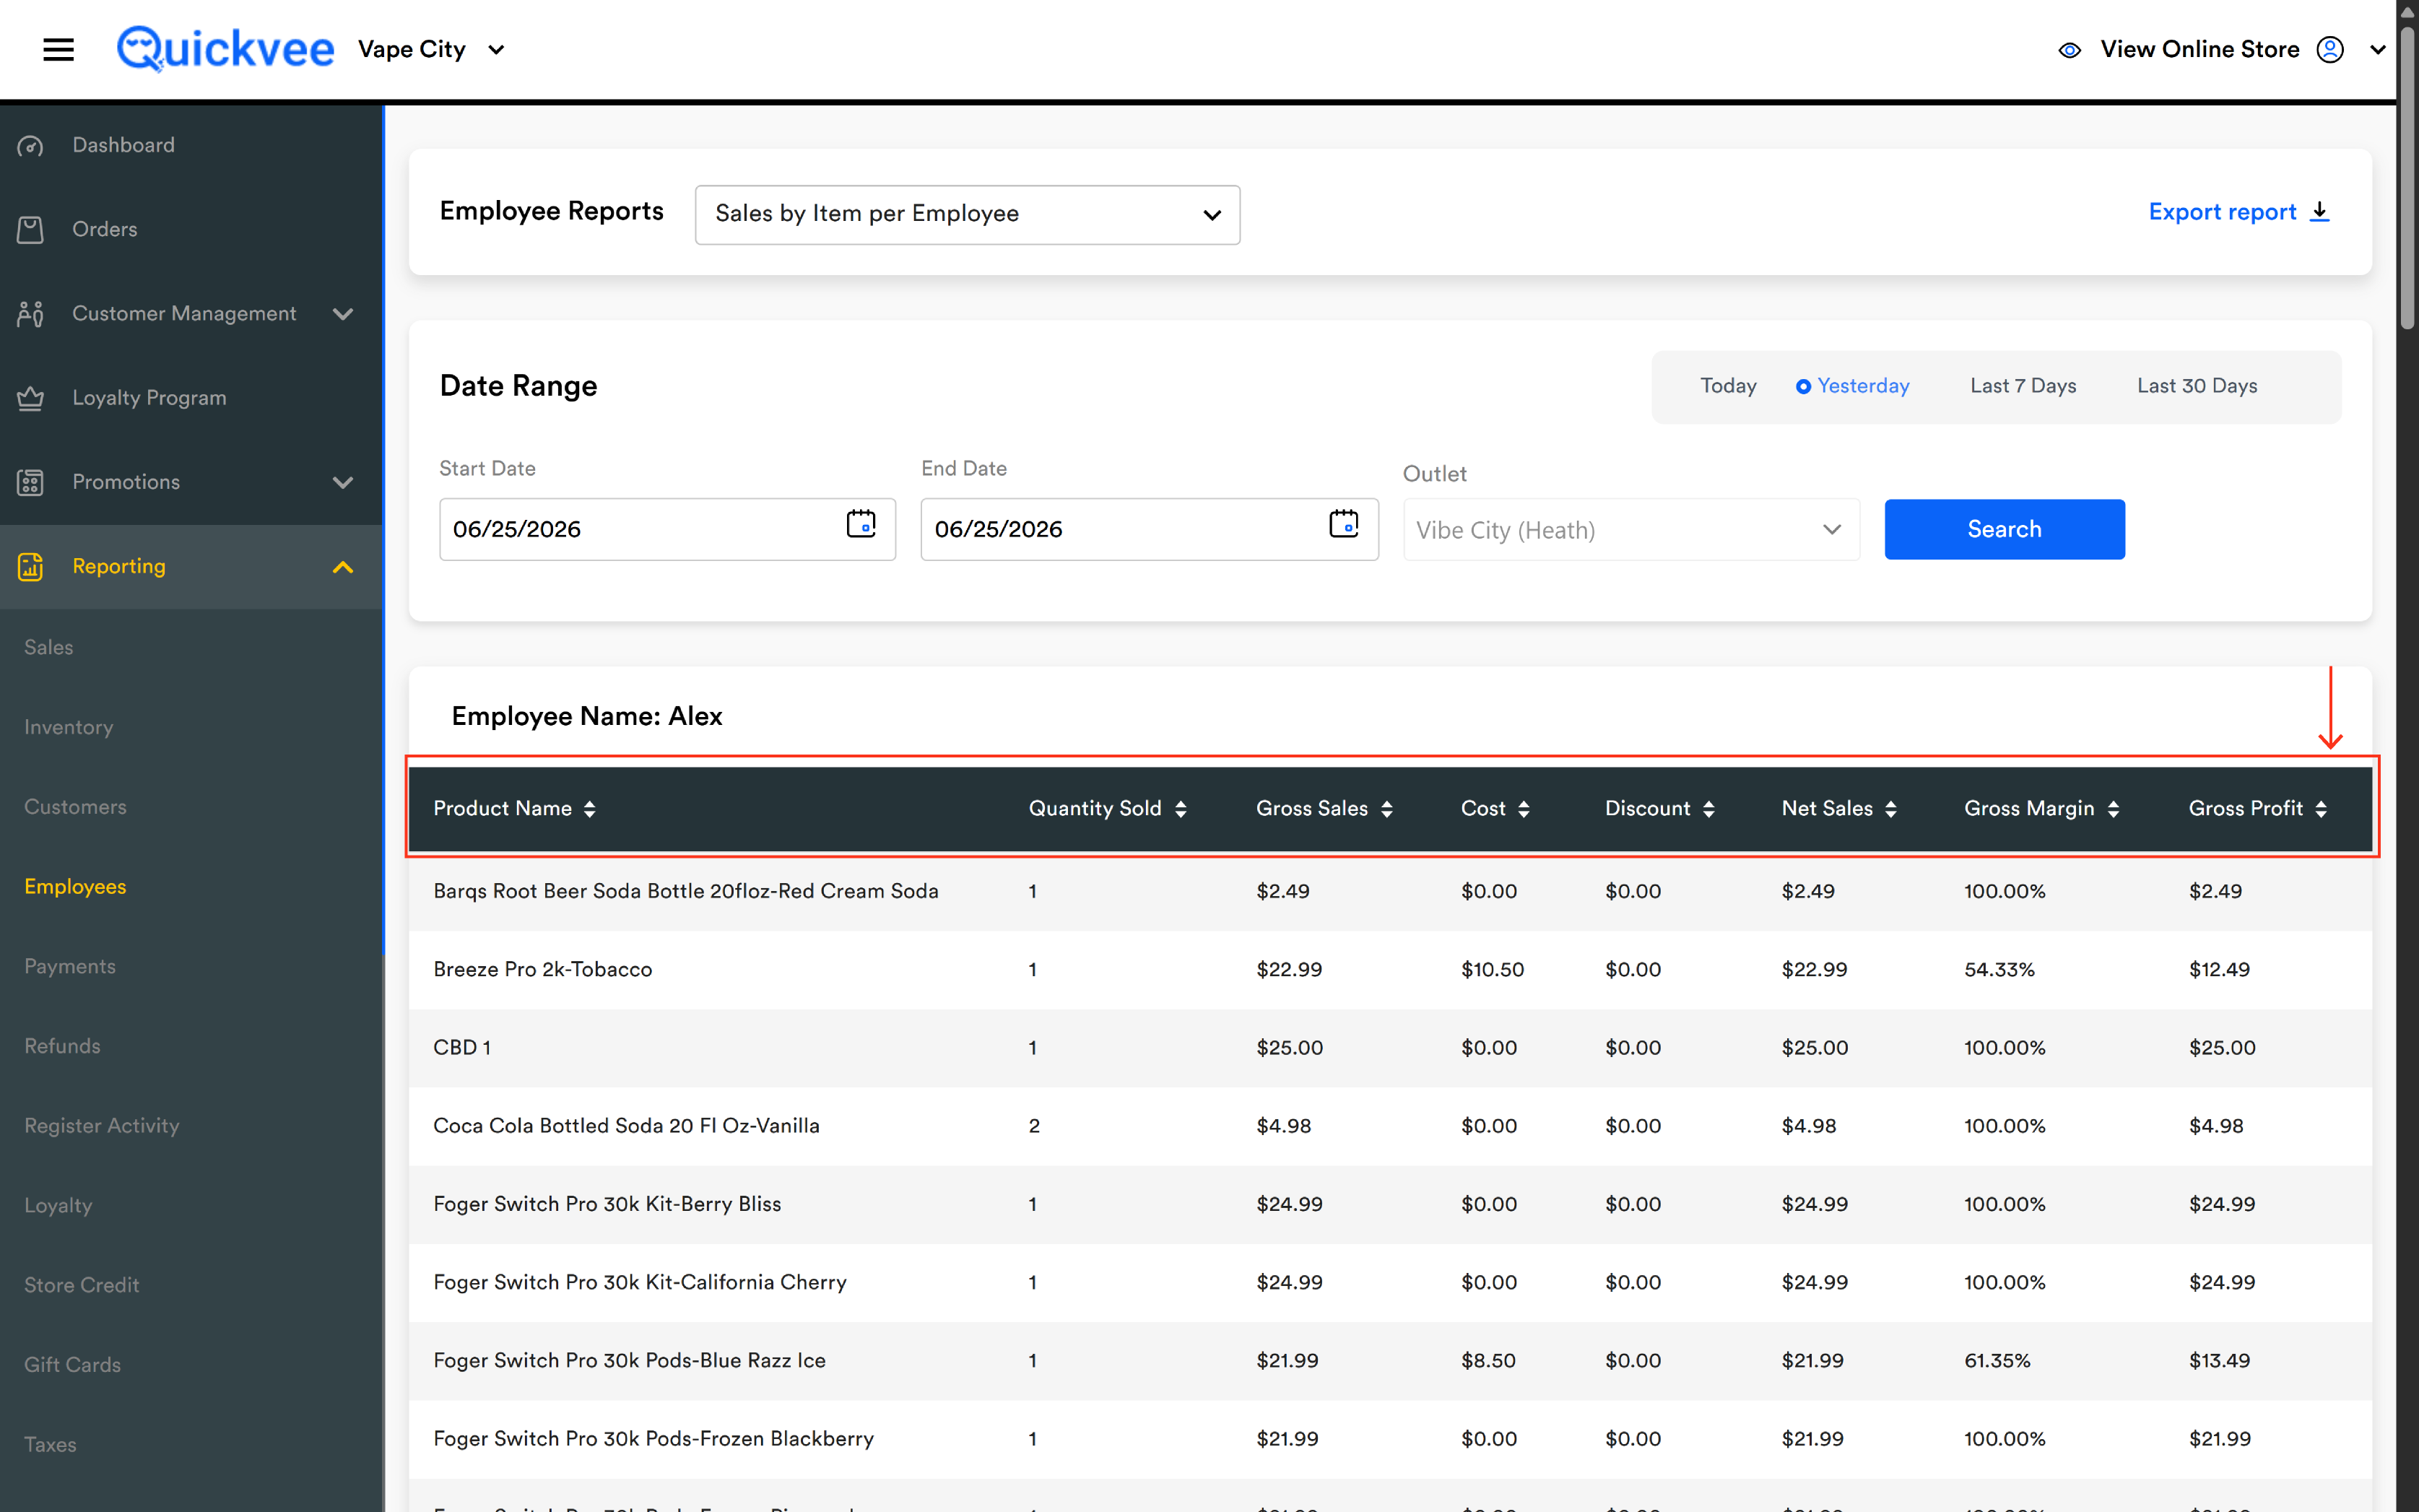
After running, the report displays as a series of stacked tables — one table per employee — each prefixed with an Employee Name header.
Inside each employee's block, every product the employee sold during the date range appears as one row. The columns are:
|
Column |
What it shows |
|---|---|
|
Product Name |
The product or variant name as it appears in your catalog. Sortable A→Z or Z→A. |
|
Quantity Sold |
The total units of this product the employee sold during the date range. Sortable. |
|
Gross Sales |
The pre-discount, pre-tax total for that product line — units × retail price. Sortable. |
|
Cost |
The total cost-of-goods — units × cost per item. Sortable. |
|
Discount |
The total discount applied across the line — both line-level coupons and order-level discounts distributed proportionally. Sortable. |
|
Net Sales |
Gross Sales minus Discount — what actually came in for that product line. Sortable. |
|
Gross Margin |
The margin percentage — (Net Sales − Cost) ÷ Net Sales, expressed as a percent. Sortable. |
|
Gross Profit |
The actual dollar profit — Net Sales − Cost. Sortable. |
Every column header carries a sort indicator (↑↓). Sort is per-employee — sorting Gross Profit high-to-low for one employee reorders that block only; other employee blocks keep their original order.
Discount is line-aware. Order-level discounts applied at checkout (whole-cart percent off, dollar off, manager comp) are distributed proportionally across line items and show up in the Discount column on each product. You'll never see a discount in this report that wasn't actually applied to a specific line.
A negative Gross Profit on a row usually means a discount was larger than the markup. Common with promotional pricing or accidental comps — worth a manager review when it shows up.
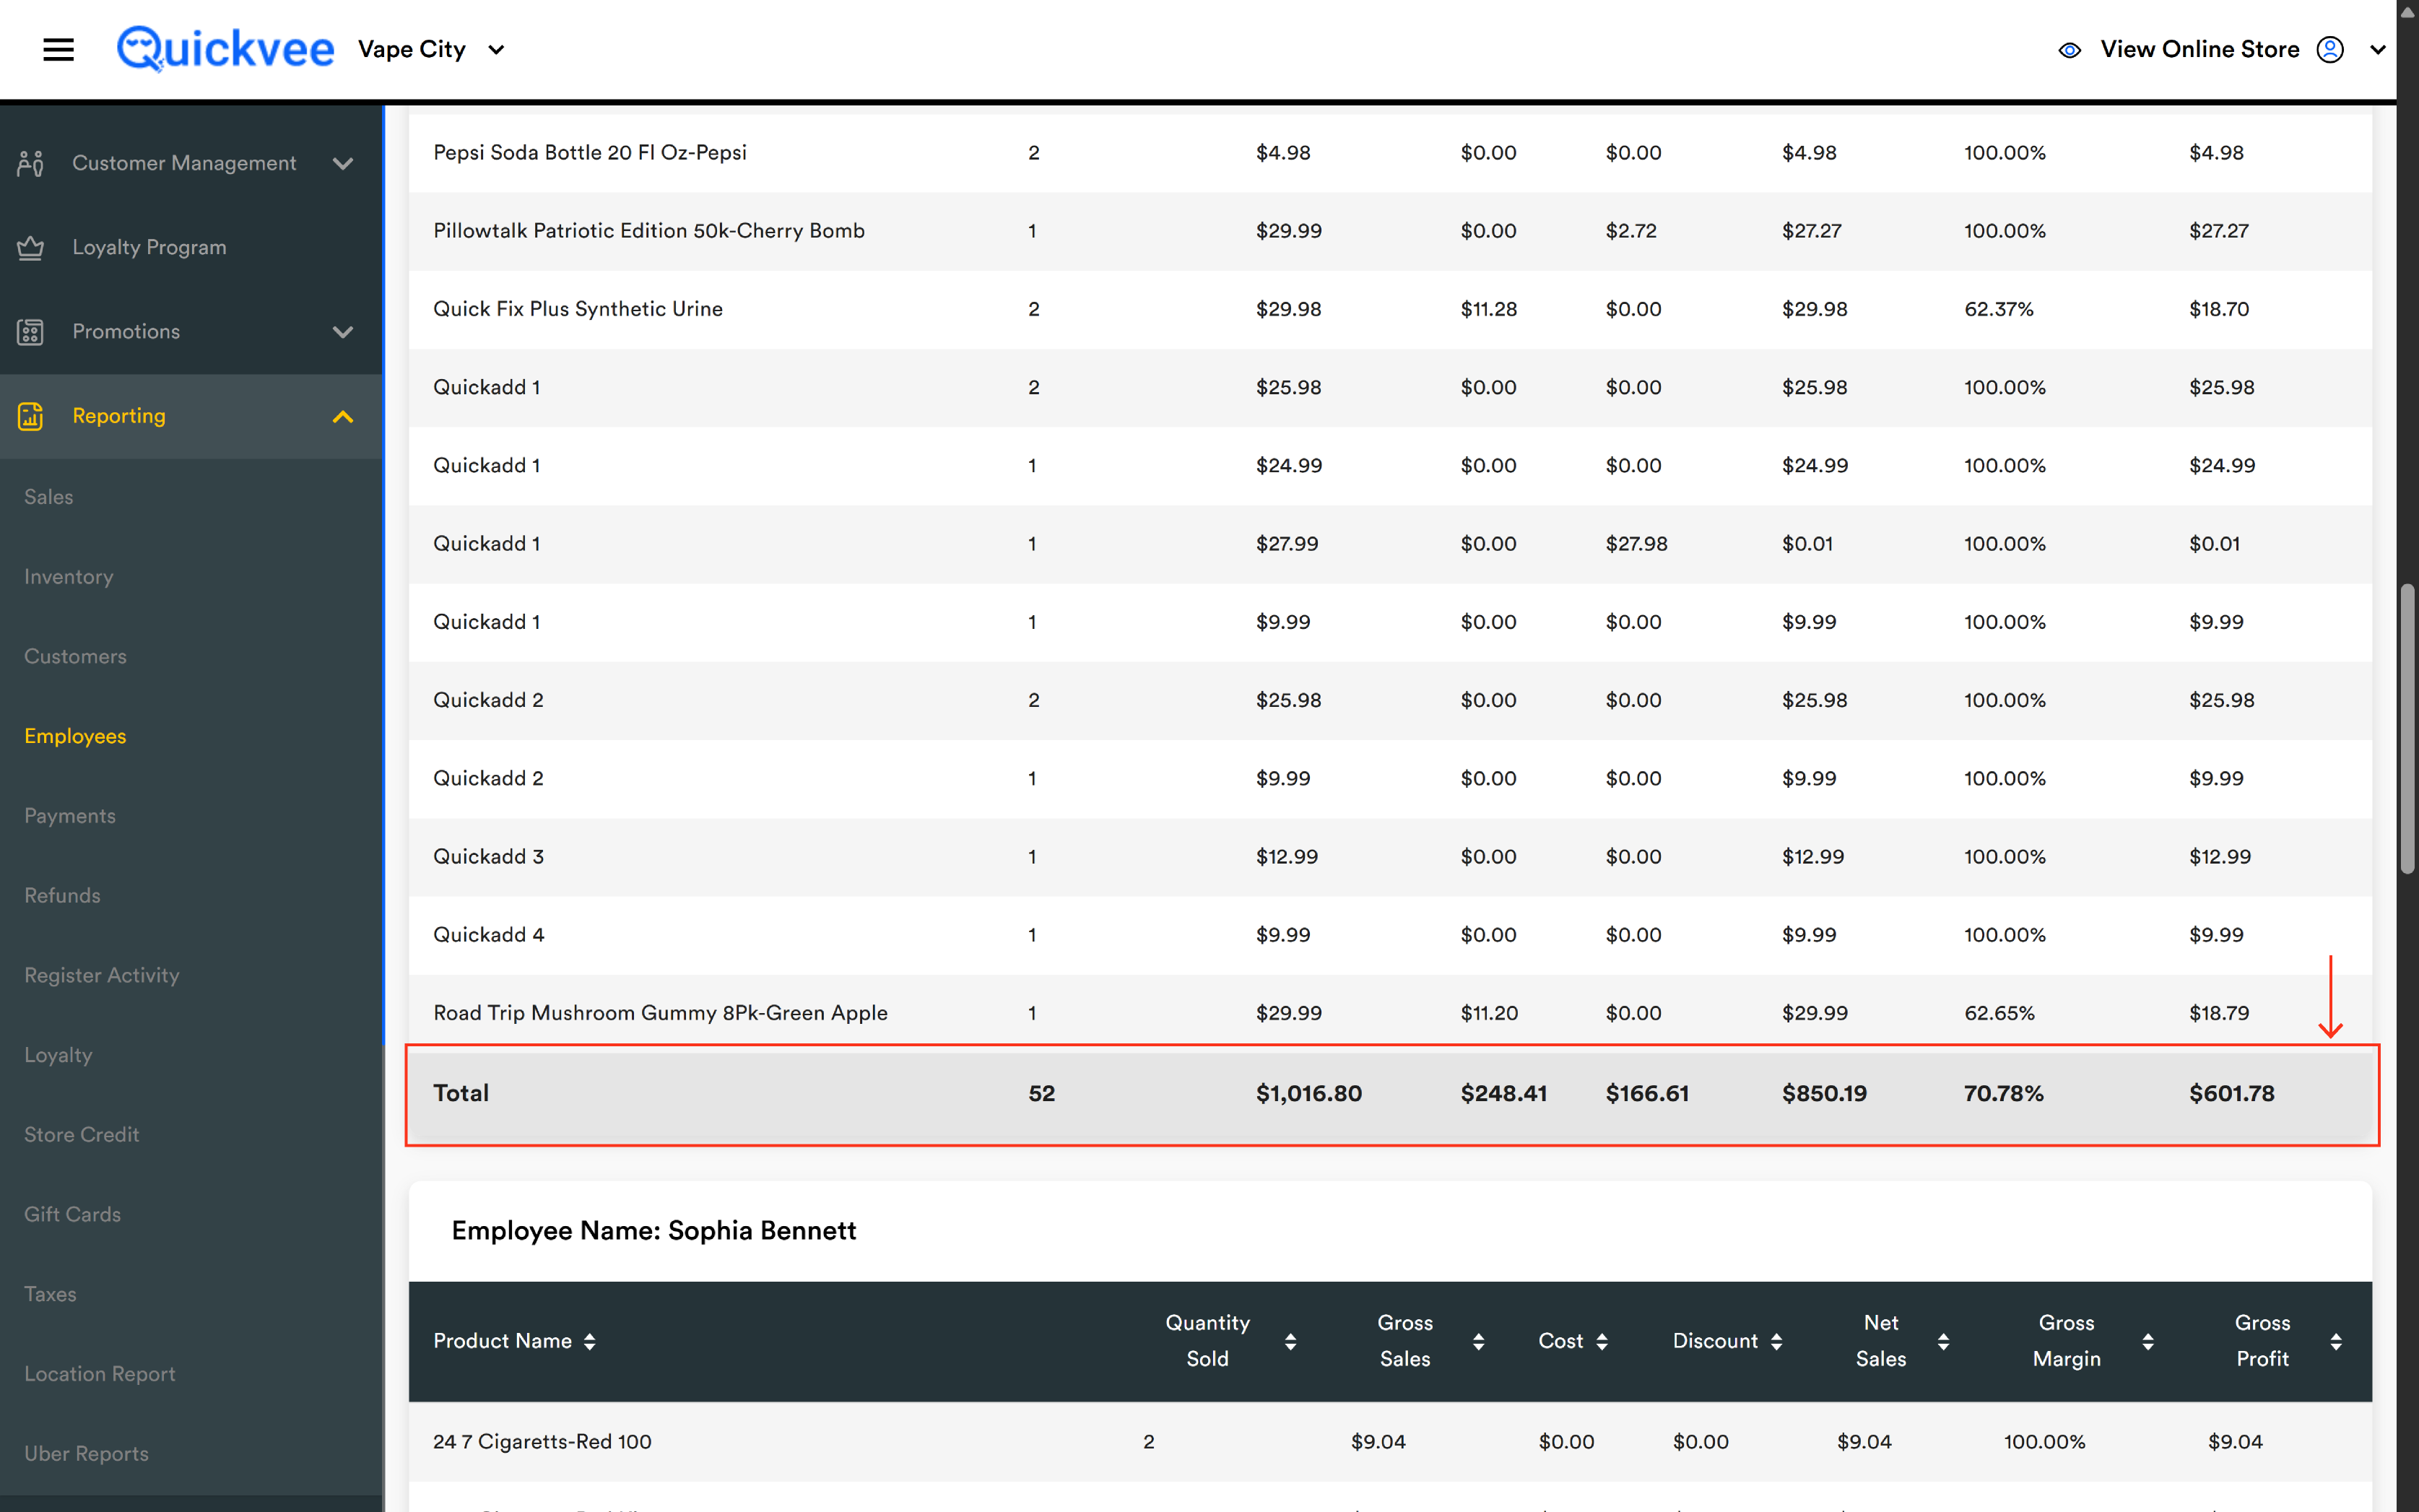
The Total row
The last row of every employee's block is a Total row that aggregates the columns:
|
Column |
Total shows |
|---|---|
|
Quantity Sold |
The total units of all products the employee sold in the period. |
|
Gross Sales |
Sum of every product's Gross Sales for the employee. |
|
Cost |
Sum of every product's Cost. |
|
Discount |
Sum of every product's Discount. |
|
Net Sales |
Sum of every product's Net Sales — the employee's total revenue contribution. |
|
Gross Margin |
The weighted average margin across all products — not a simple average of the row percentages. Weighted by Net Sales. |
|
Gross Profit |
Sum of every product's Gross Profit — the employee's total profit contribution. |
The Total row's Gross Margin is weighted, not averaged. If an employee sold one cigarette pack at 10% margin and one pre-roll at 60% margin, the total margin won't be 35% — it'll be weighted by how many revenue dollars came from each line. This is the right behavior for commission calculations.
What to do with the report
|
Question |
How to answer it |
|---|---|
|
Which employee sold the most of a specific product? |
Run for the period → search the page for the product name → compare quantities across blocks. |
|
Who's most efficient at moving high-margin items? |
Sort each employee's block by Gross Profit high-to-low and compare the top items. |
|
Did anyone accidentally over-discount a sale? |
Scan the Discount column for unusually large values relative to Gross Sales. |
|
What's an employee's commissionable profit for the period? |
Read the Gross Profit total in their block — or export and apply your commission formula in Excel. |
|
Are loss-leaders being rung up at full discount? |
Sort by Gross Profit low-to-high — negative or near-zero rows are the candidates to investigate. |
|
Which staff member ran the most transactions today? |
Quick-range Today, then compare the Quantity Sold totals across employee blocks. |
Notes
-
The report covers the selected outlet only. Switch the Outlet dropdown and re-run to compare across locations.
-
An employee block only appears if that employee made at least one sale in the date range. Employees with zero sales are not shown.
-
Refunded items are excluded from this report — refunds appear in the dedicated Refunds report under Reporting.
-
BOGO and Mix & Match discounts are correctly attributed to the line they were applied to.