
The Location Report gives merchants who operate more than one store a single view of how every location is performing. Pick the locations, set a date range, and the report aggregates net sales, sales count, gross profit, tax, and payment-method breakdowns across all of them. Every metric is shown two ways: rolled up at the top of the page for the selected stores combined, and broken down into per-location cards below.
Access path: Merchant Backend → Reporting → Location Report
This is the report to use when you want to compare stores side by side, see total payment-method exposure across your whole operation, spot top and bottom performers at a glance, or export a single spreadsheet that covers every location.
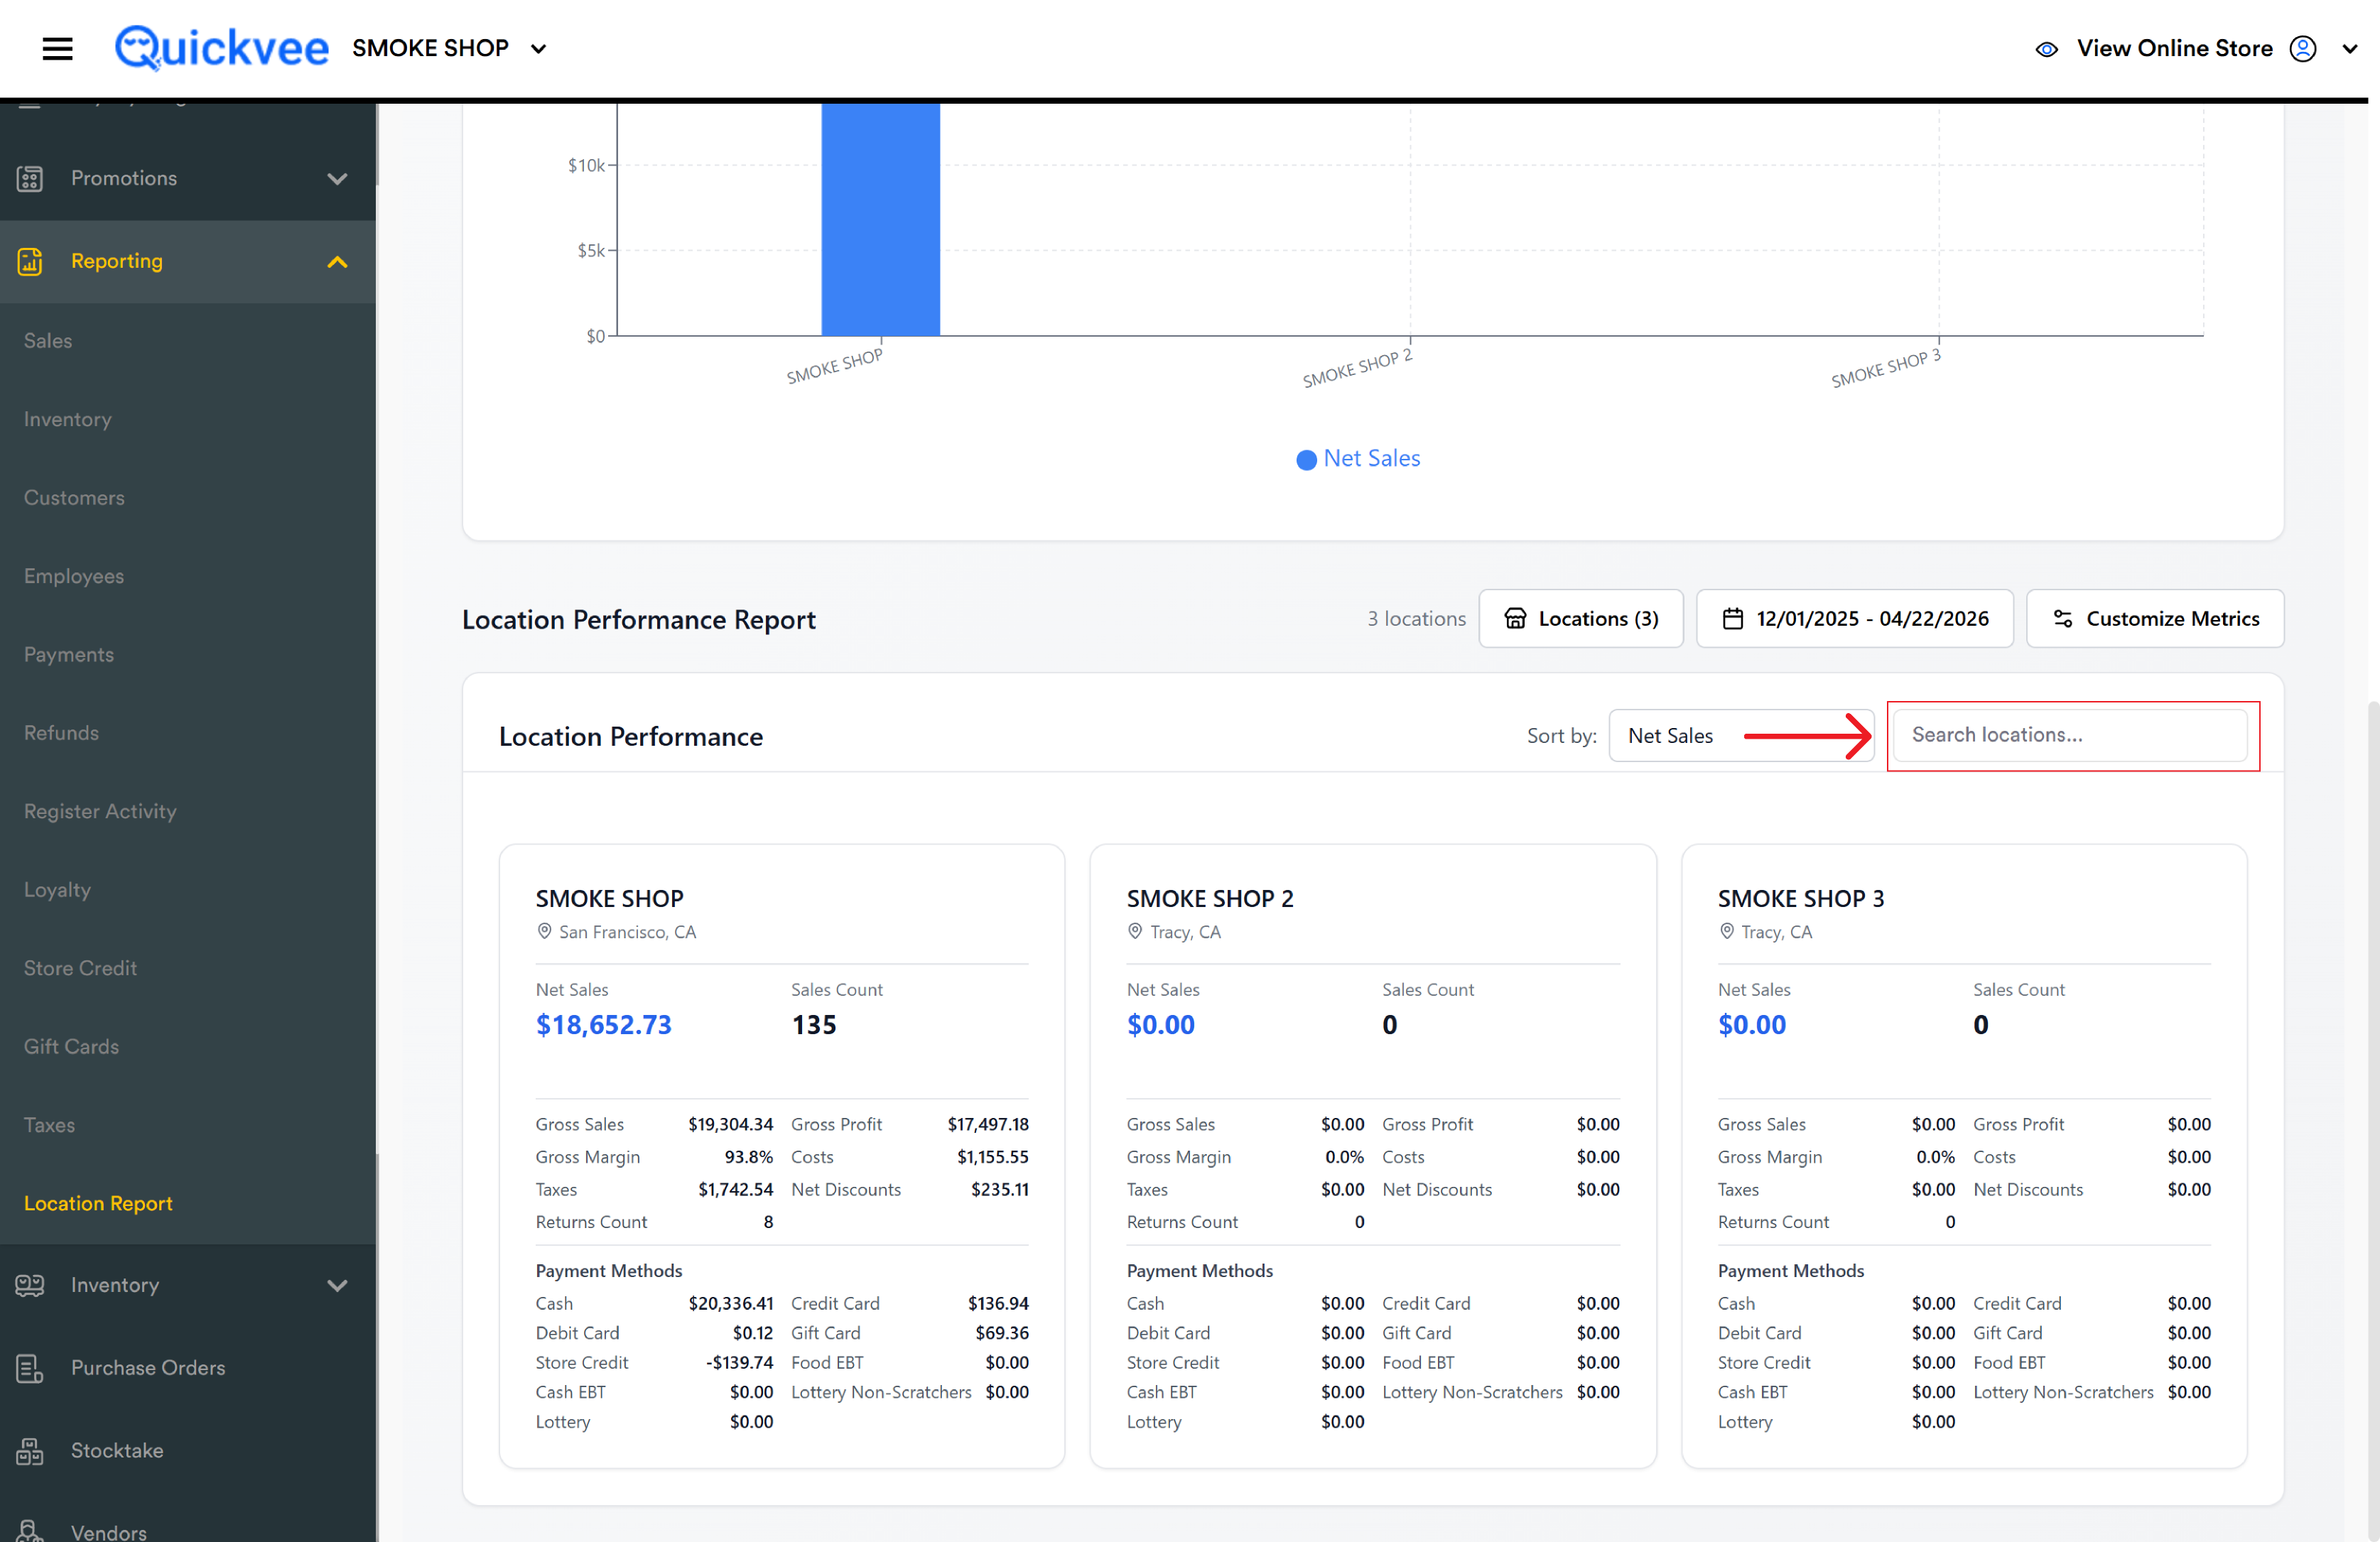
The Location Report is only meaningful if your account has more than one store attached. Single-store accounts will see only that one store's numbers — fine, but the per-store comparison tools won't tell you anything new.
Page layout at a glance
Three top controls on the right side of the page drive everything:
|
Control |
What it does |
|---|---|
|
Locations (N) |
Picks which stores are included. The number in parentheses is the count currently selected |
|
Date picker |
Sets the date range — presets or a custom Start/End. Also controls whether "day" means calendar day or business day |
|
Customize Metrics |
Toggles which data points appear on each location card; saves filter configurations to reuse later |
Below those sits an Export to Excel button.
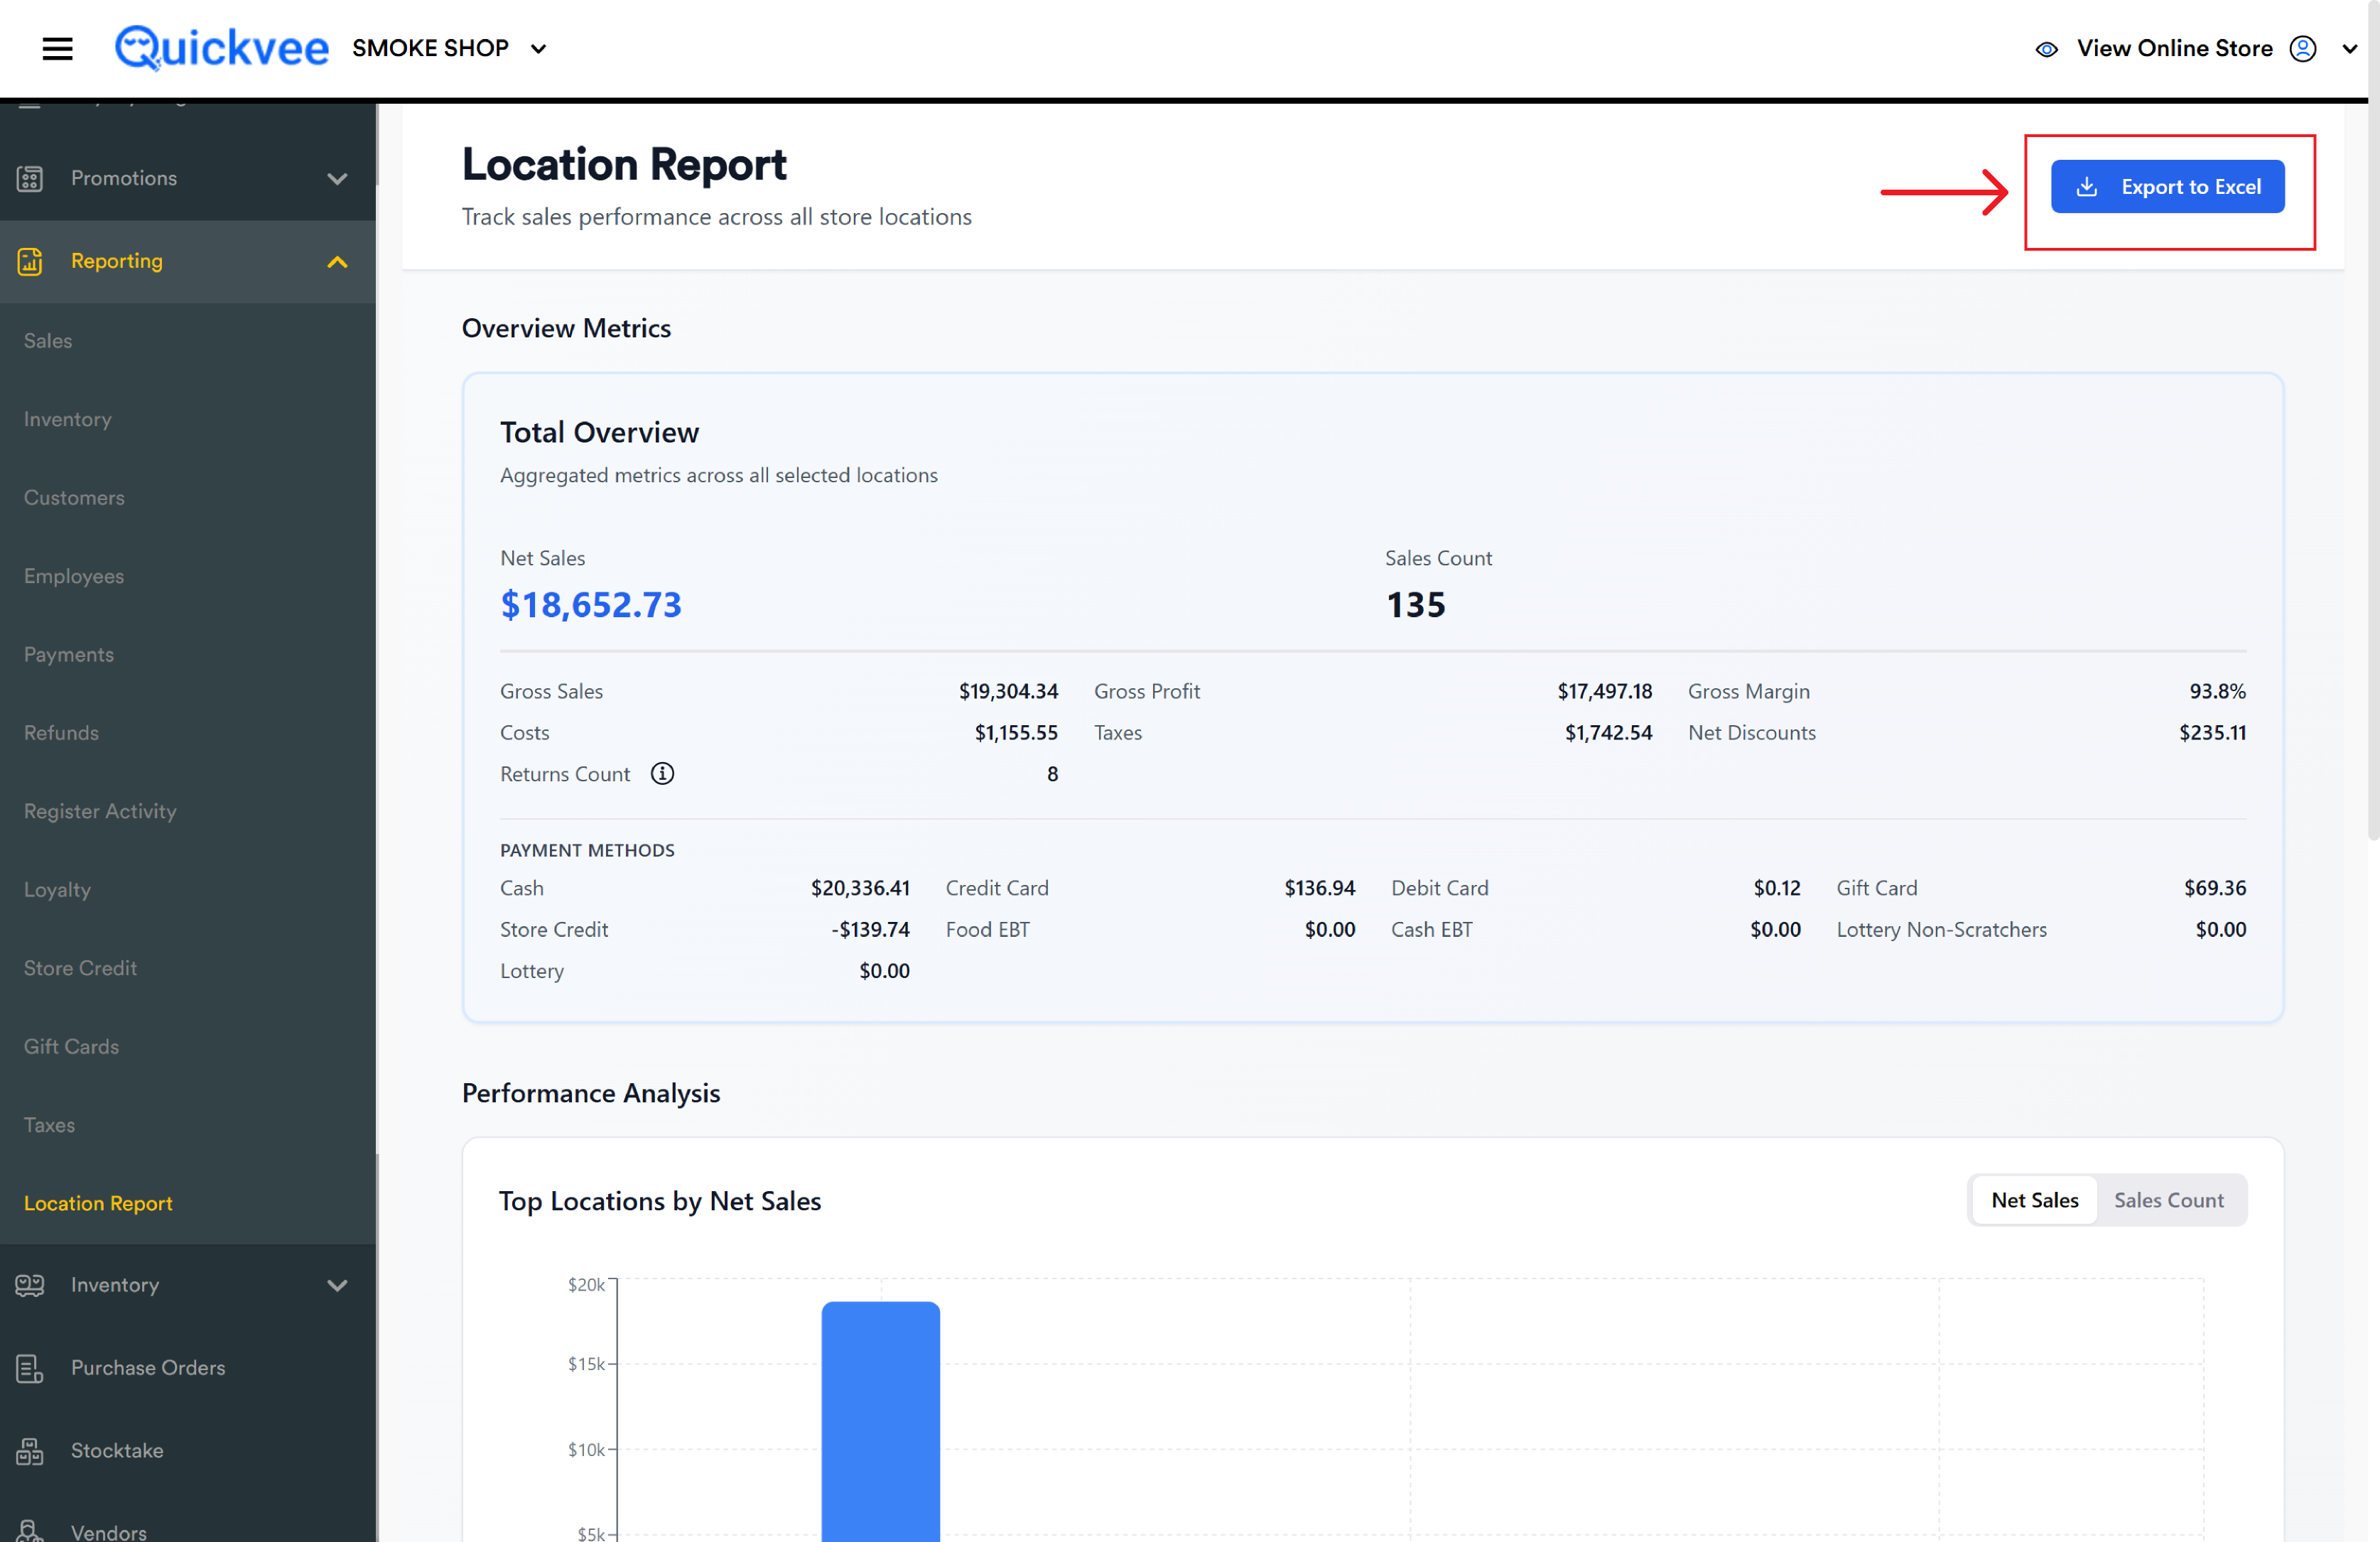
The body of the page has three sections:
-
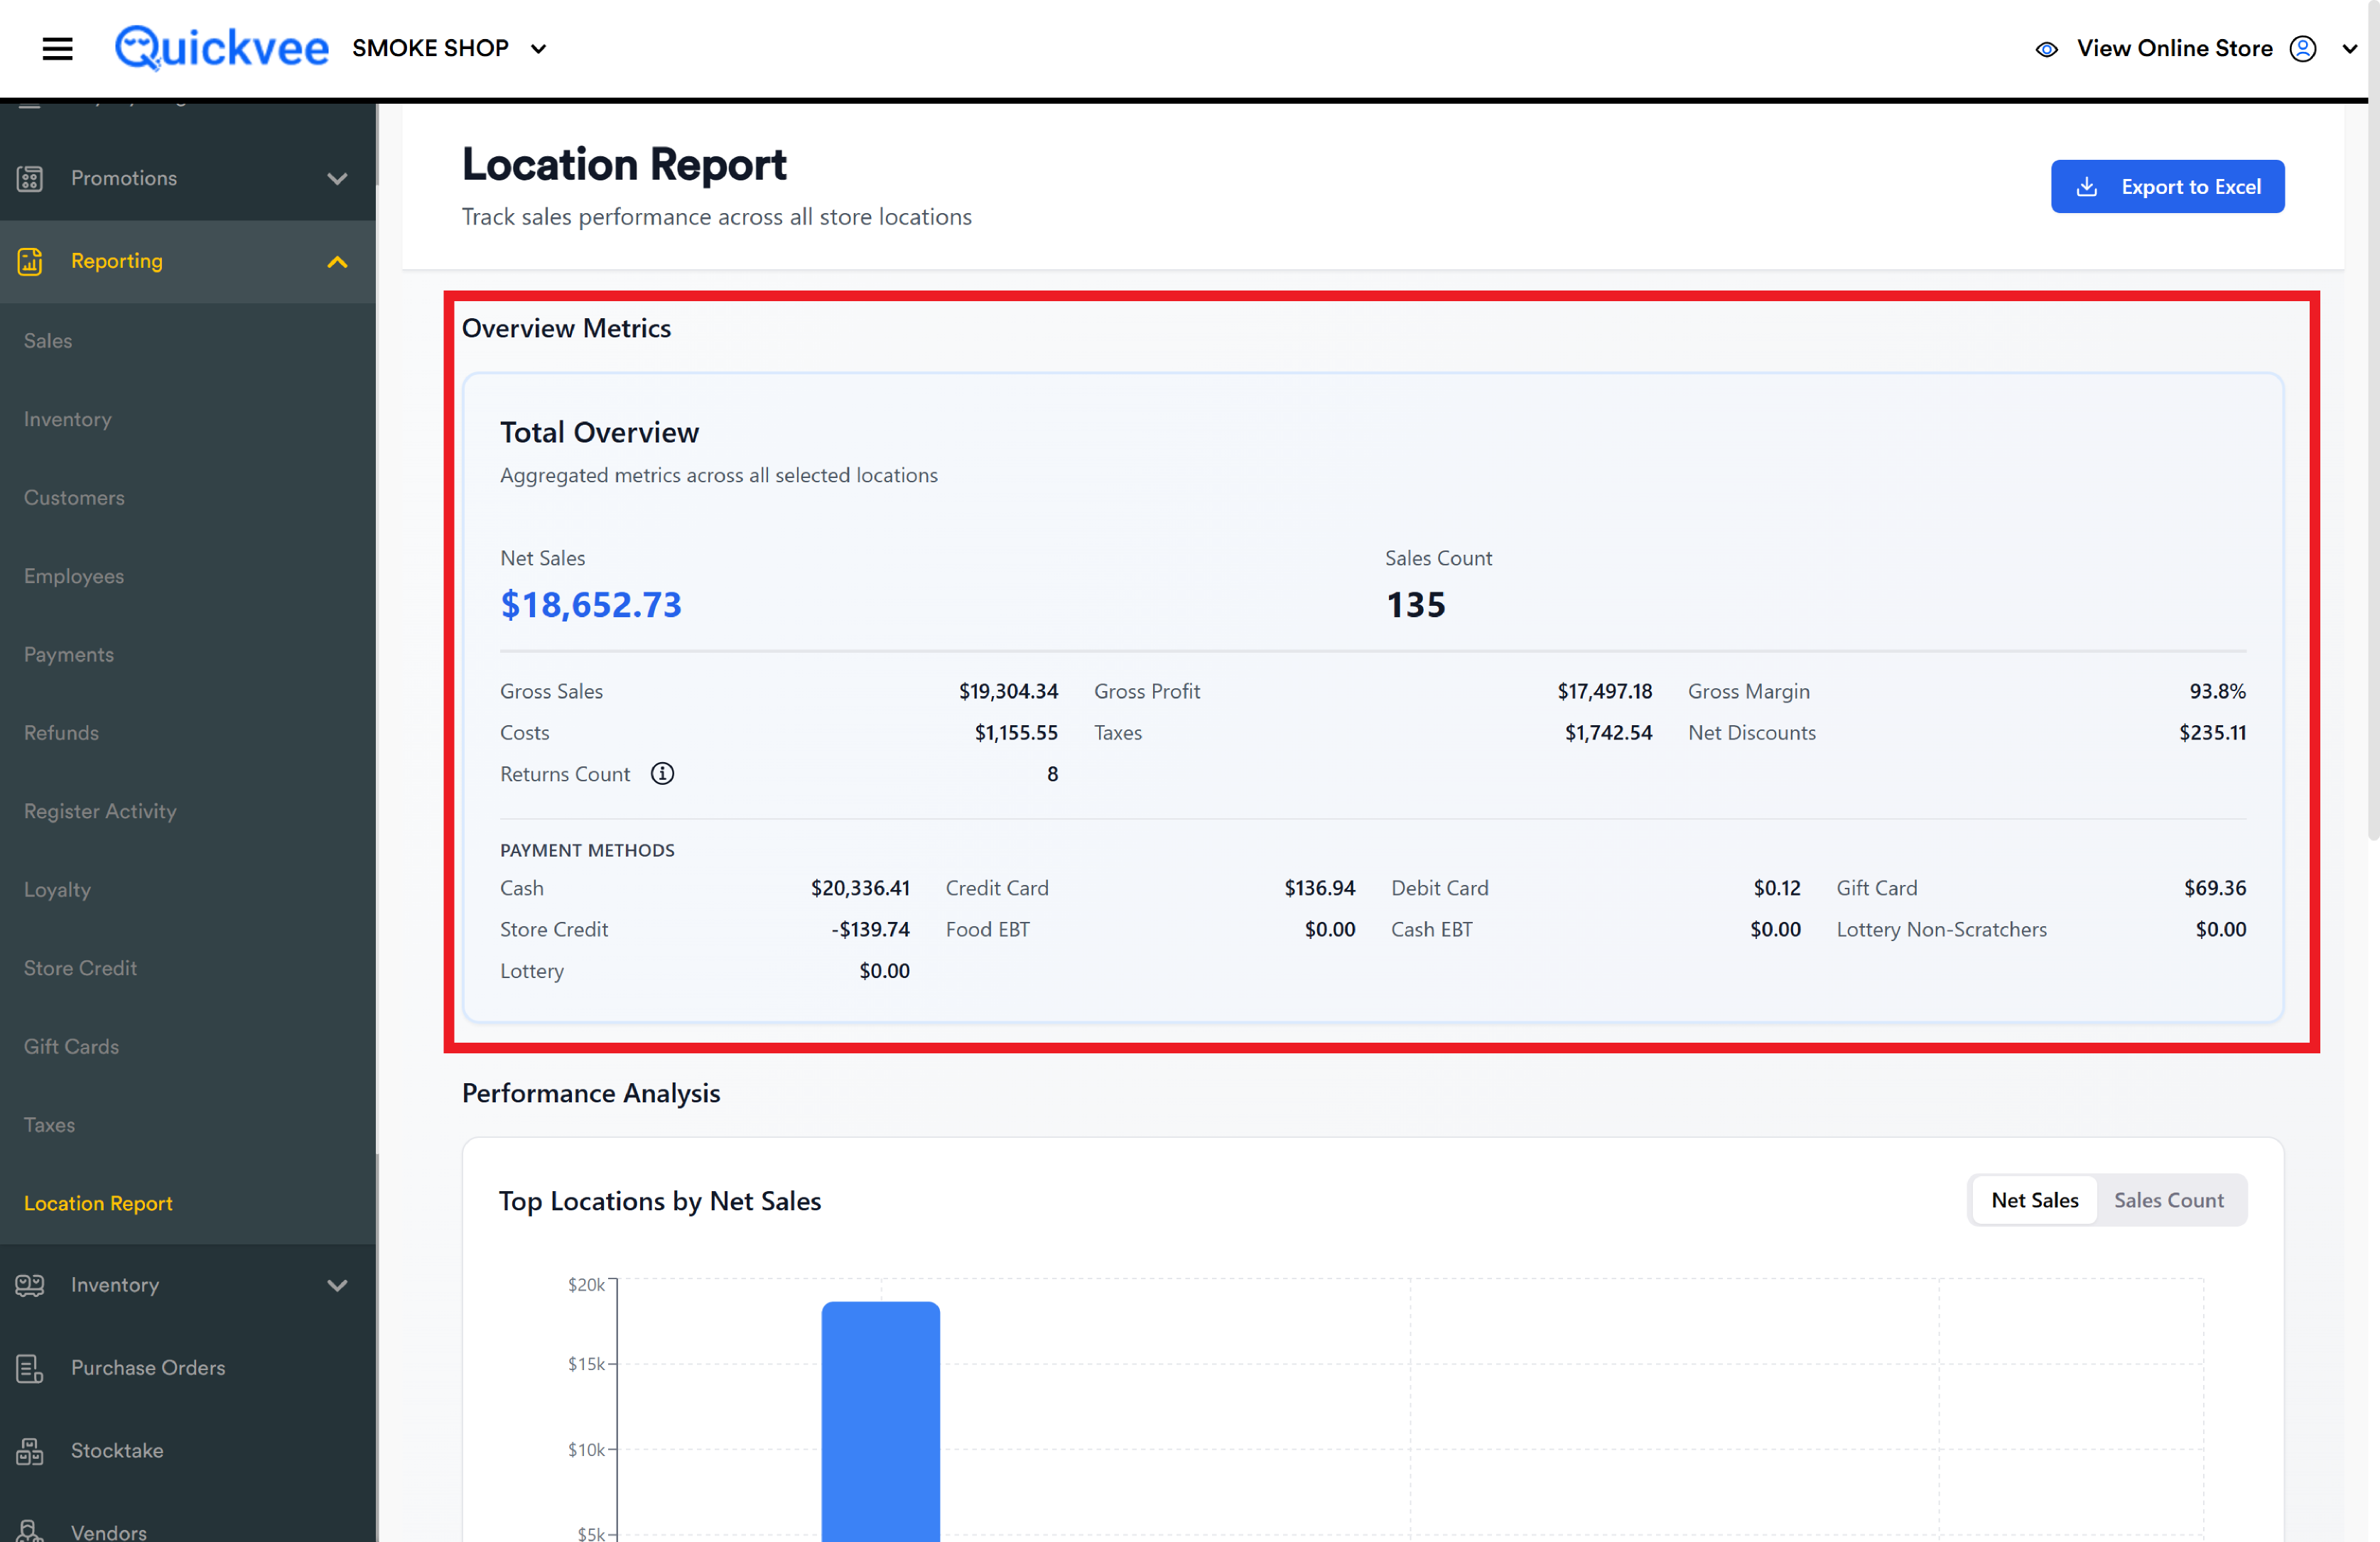
Overview Metrics — one big Total Overview card with aggregated numbers
-
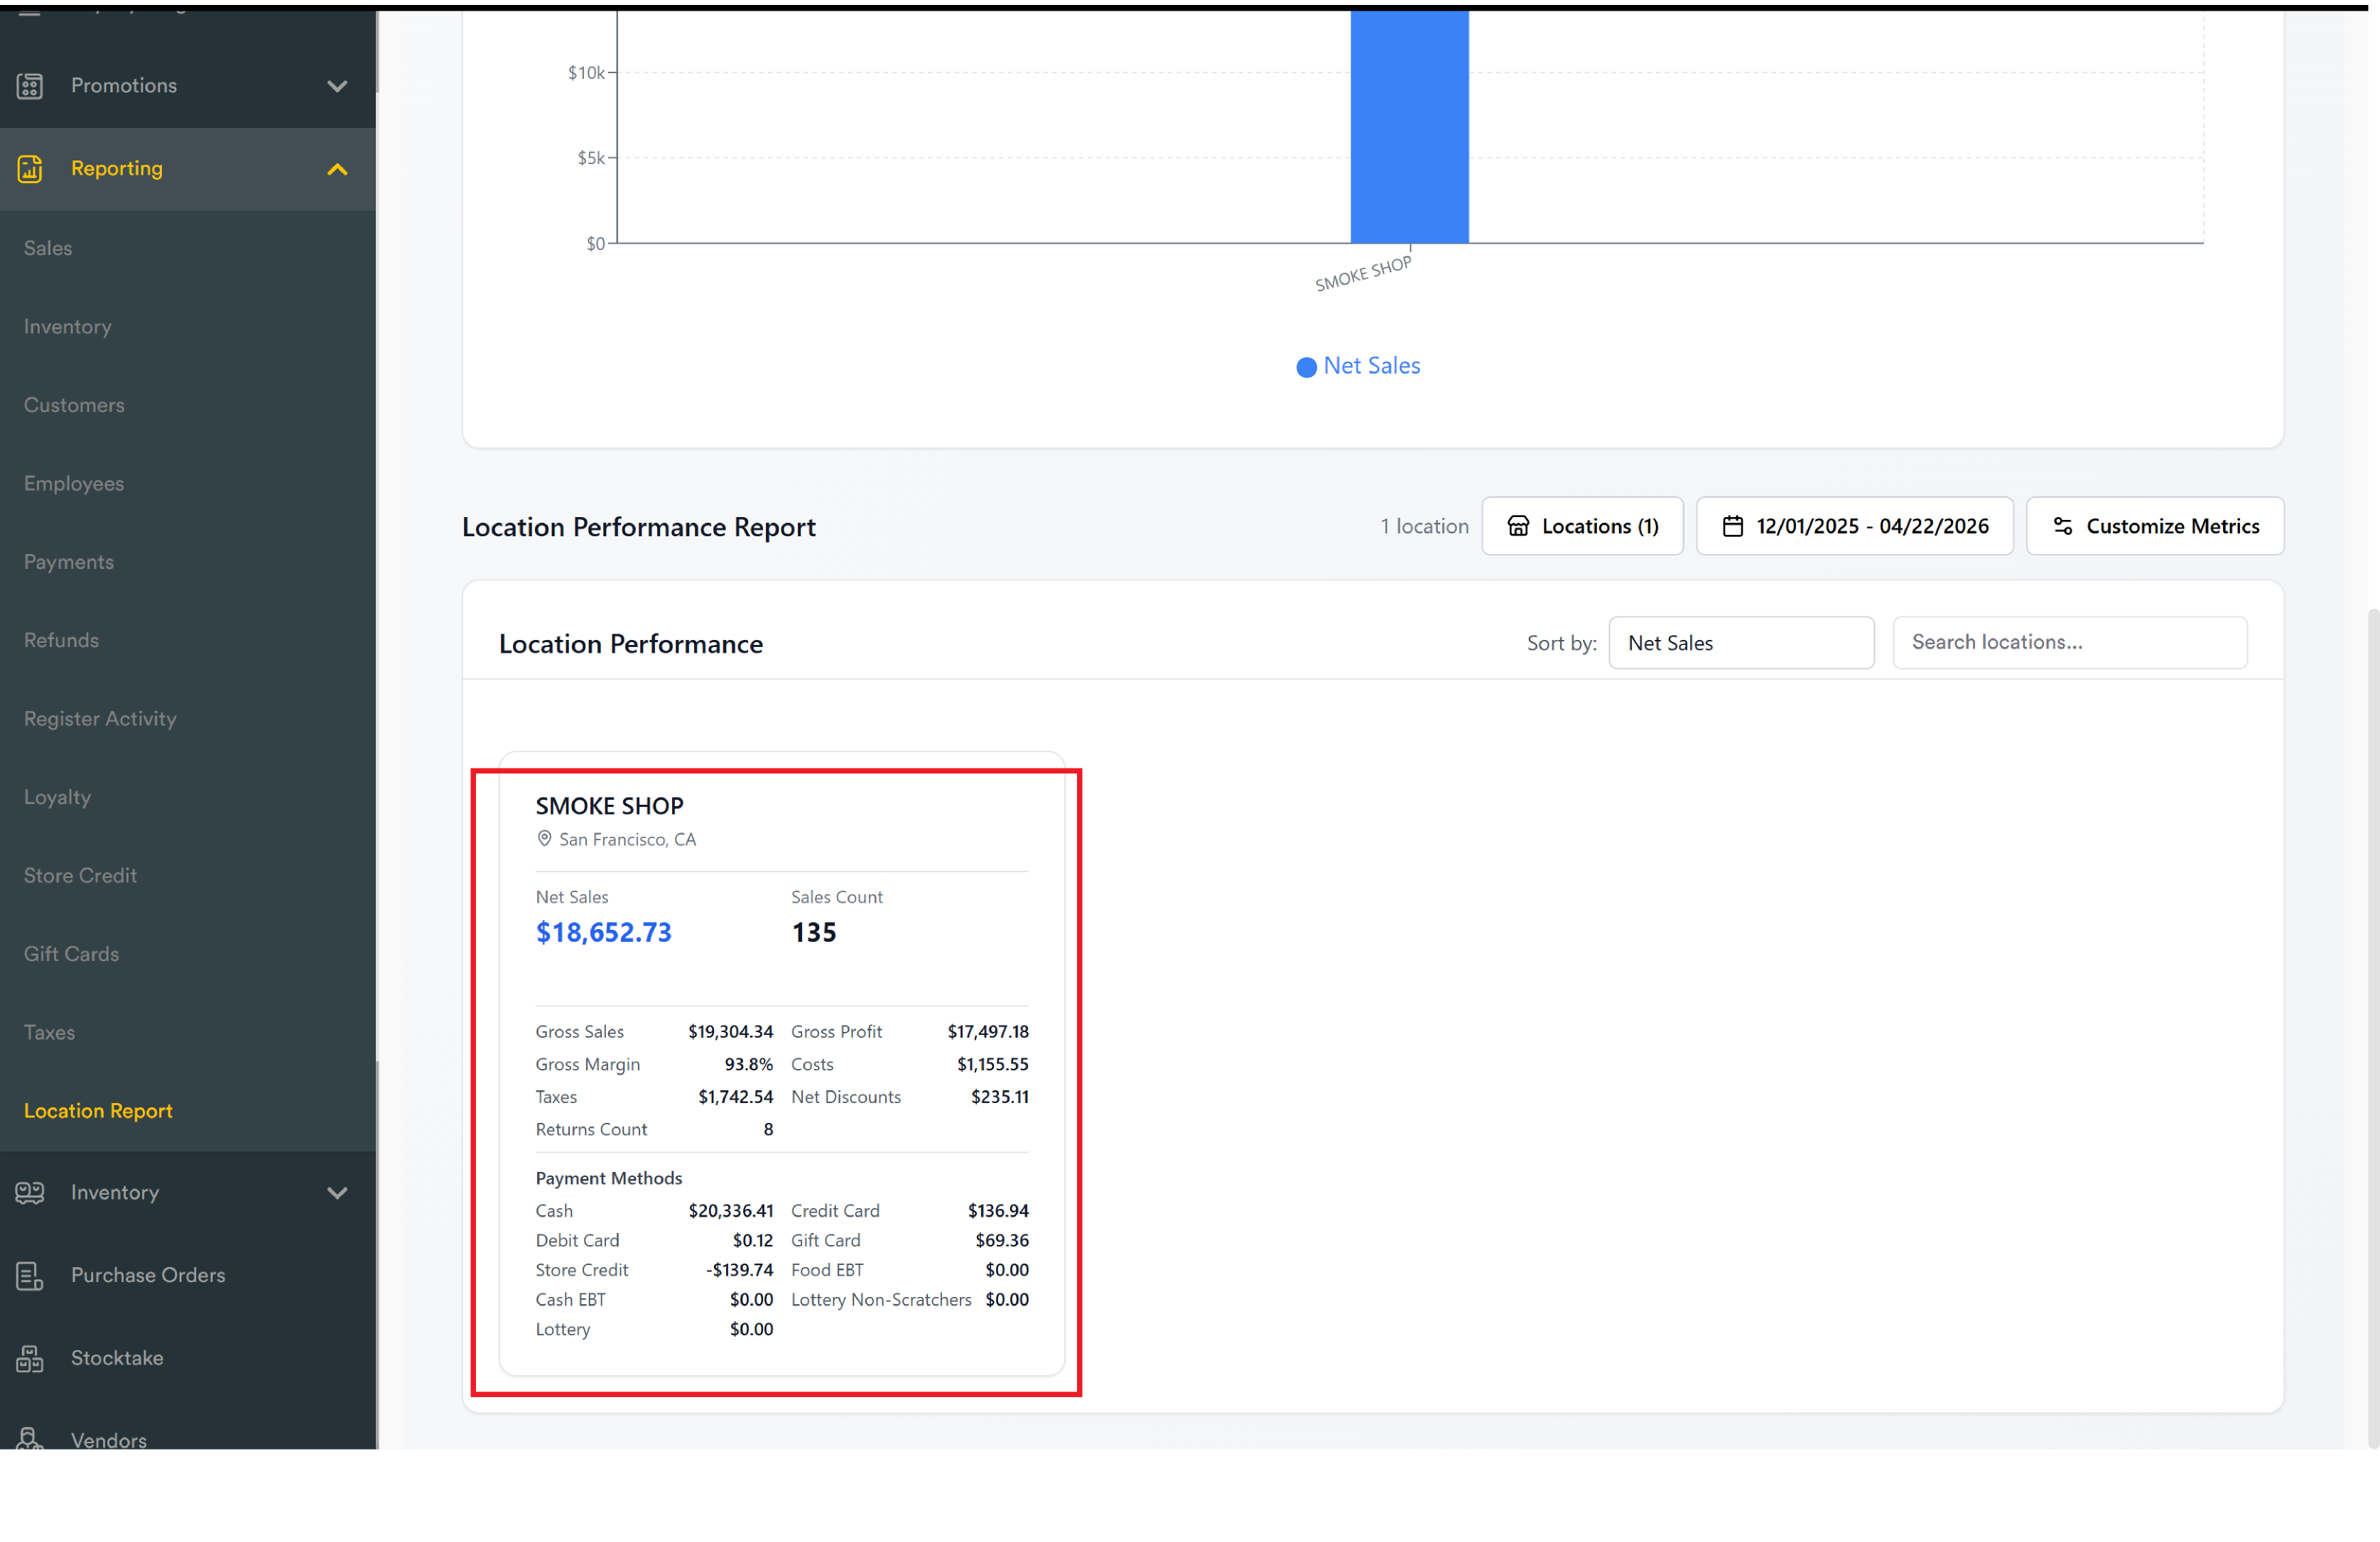
Performance Analysis — a bar chart of top locations, toggleable between Net Sales and Sales Count
-
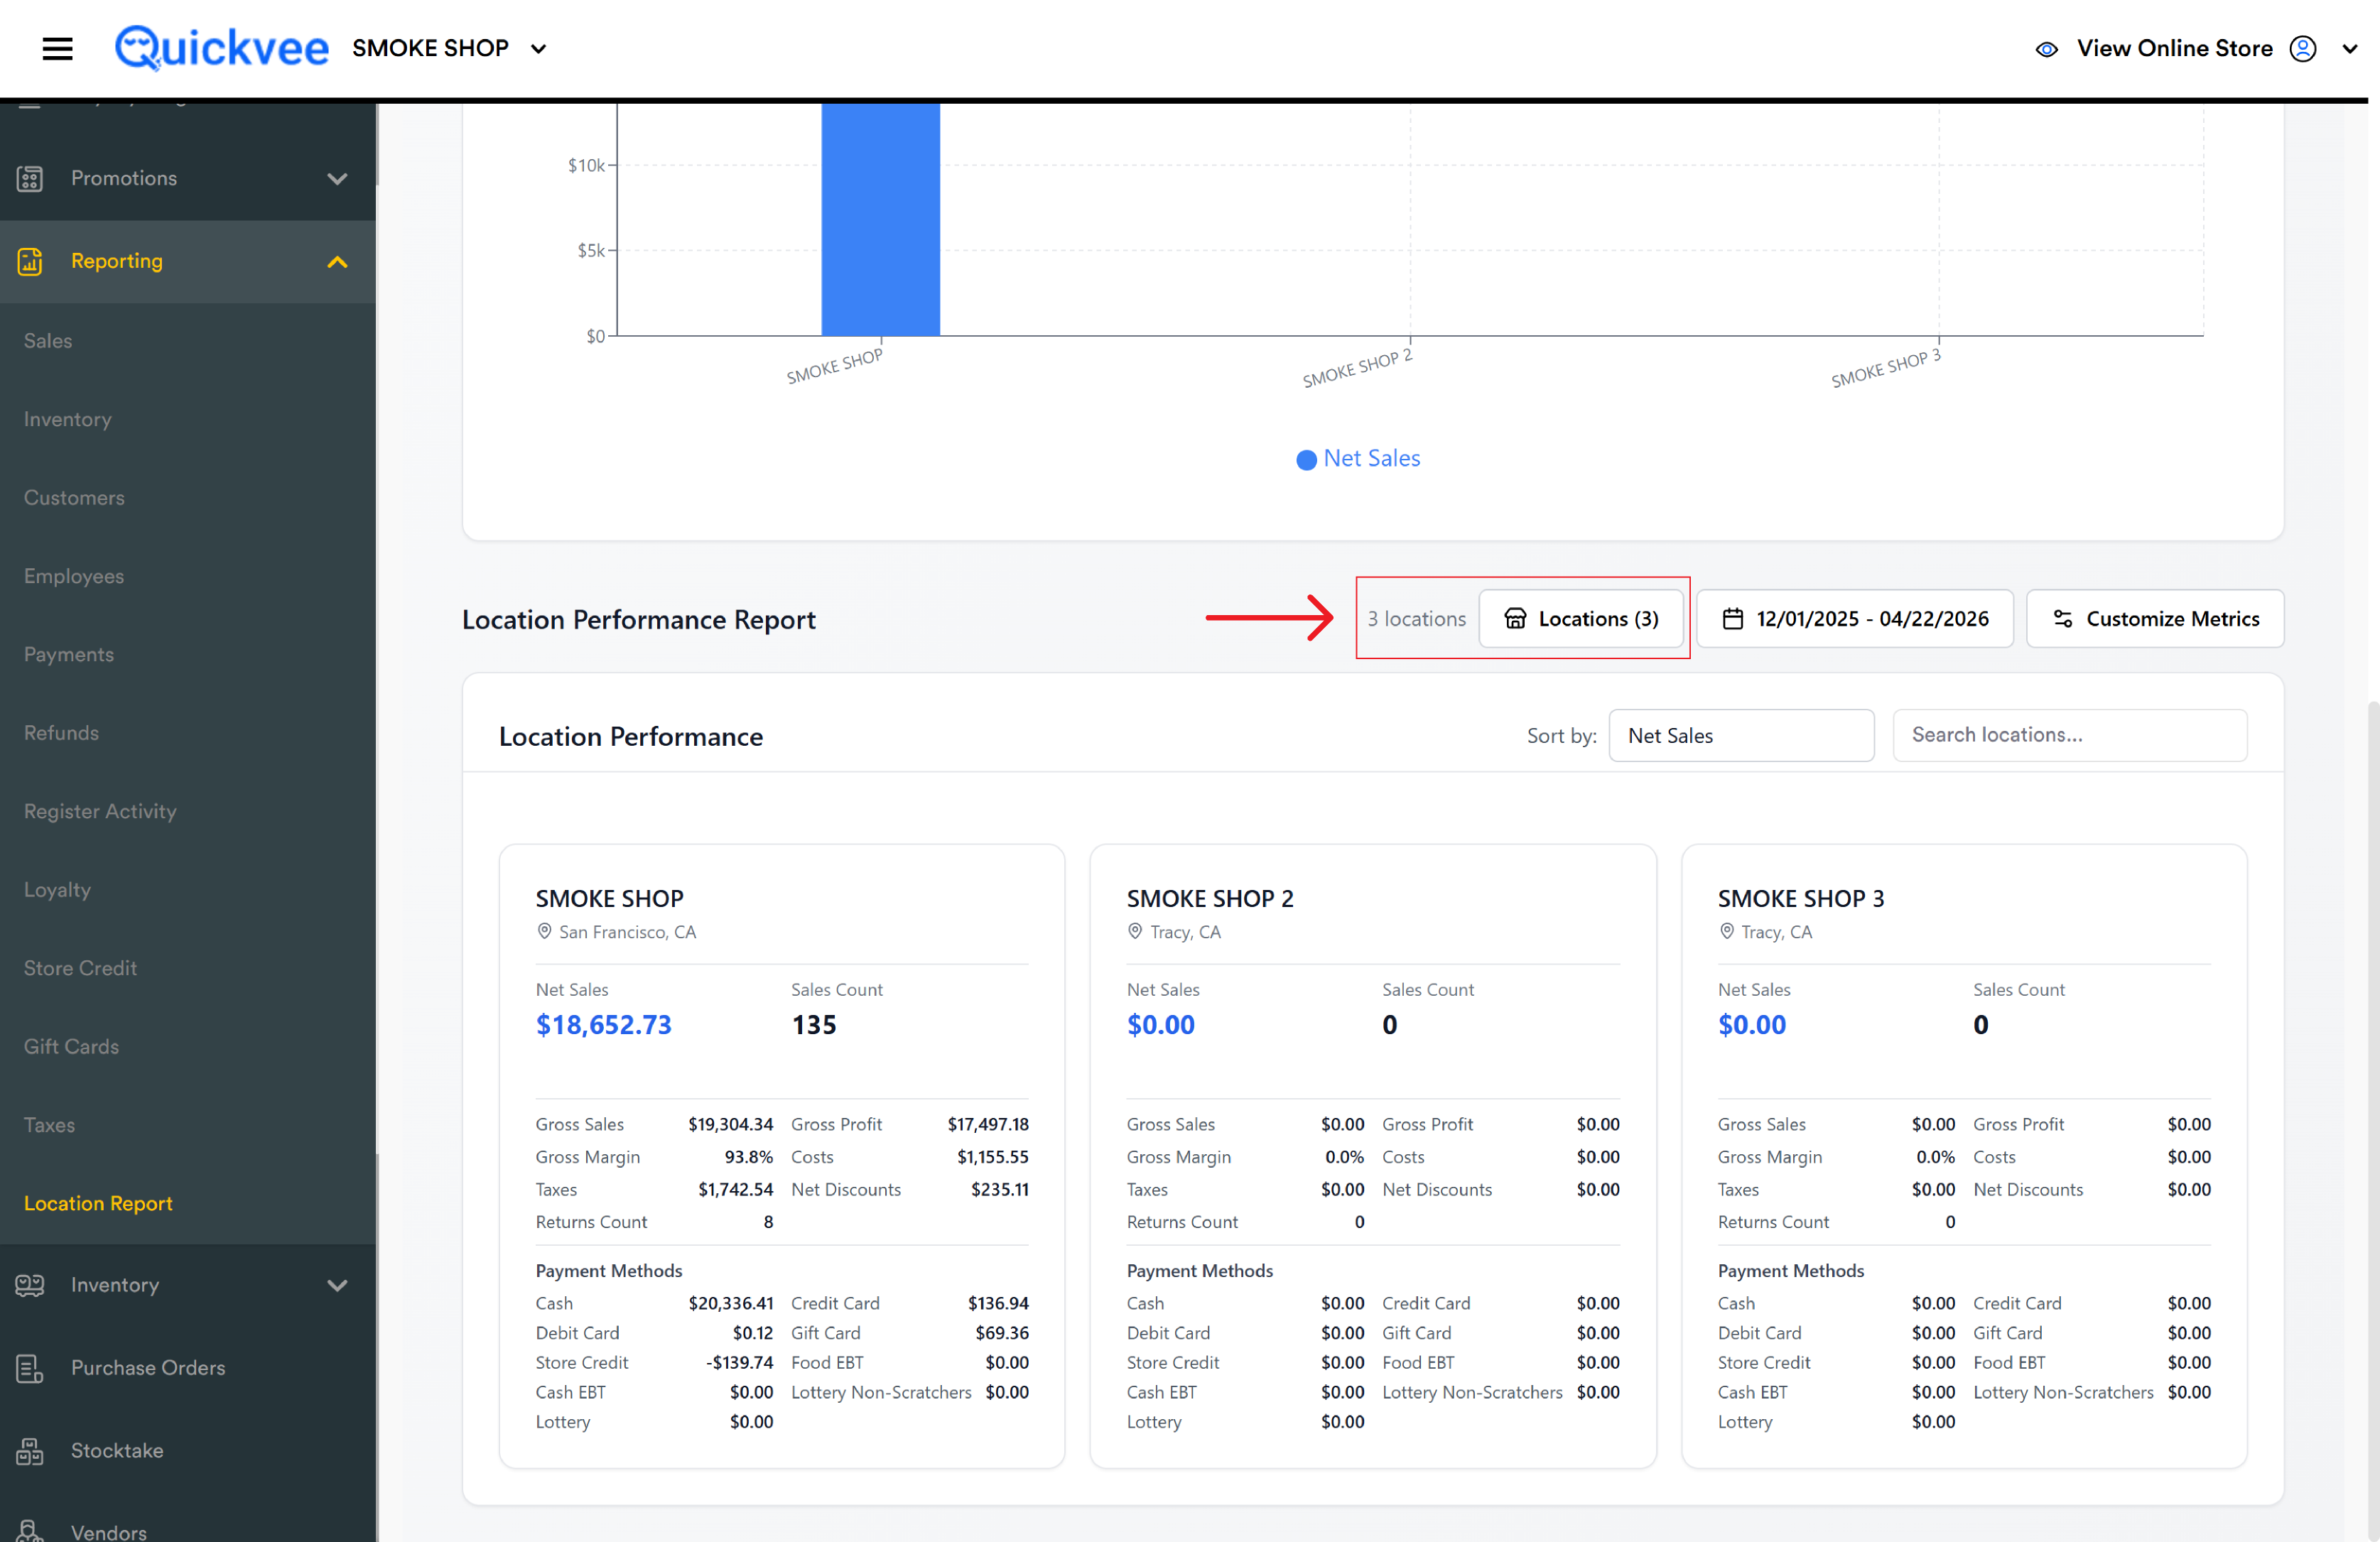
Location Performance — individual cards for every selected location, sortable and searchable
Step 1 — Select the locations
Click the Locations (N) button at the top right. A panel opens showing every store attached to your account, each with a checkmark toggle.
-
Select All — ticks every location
-
Deselect All — unticks every location
-
Search box inside the panel finds a specific store when the list is long
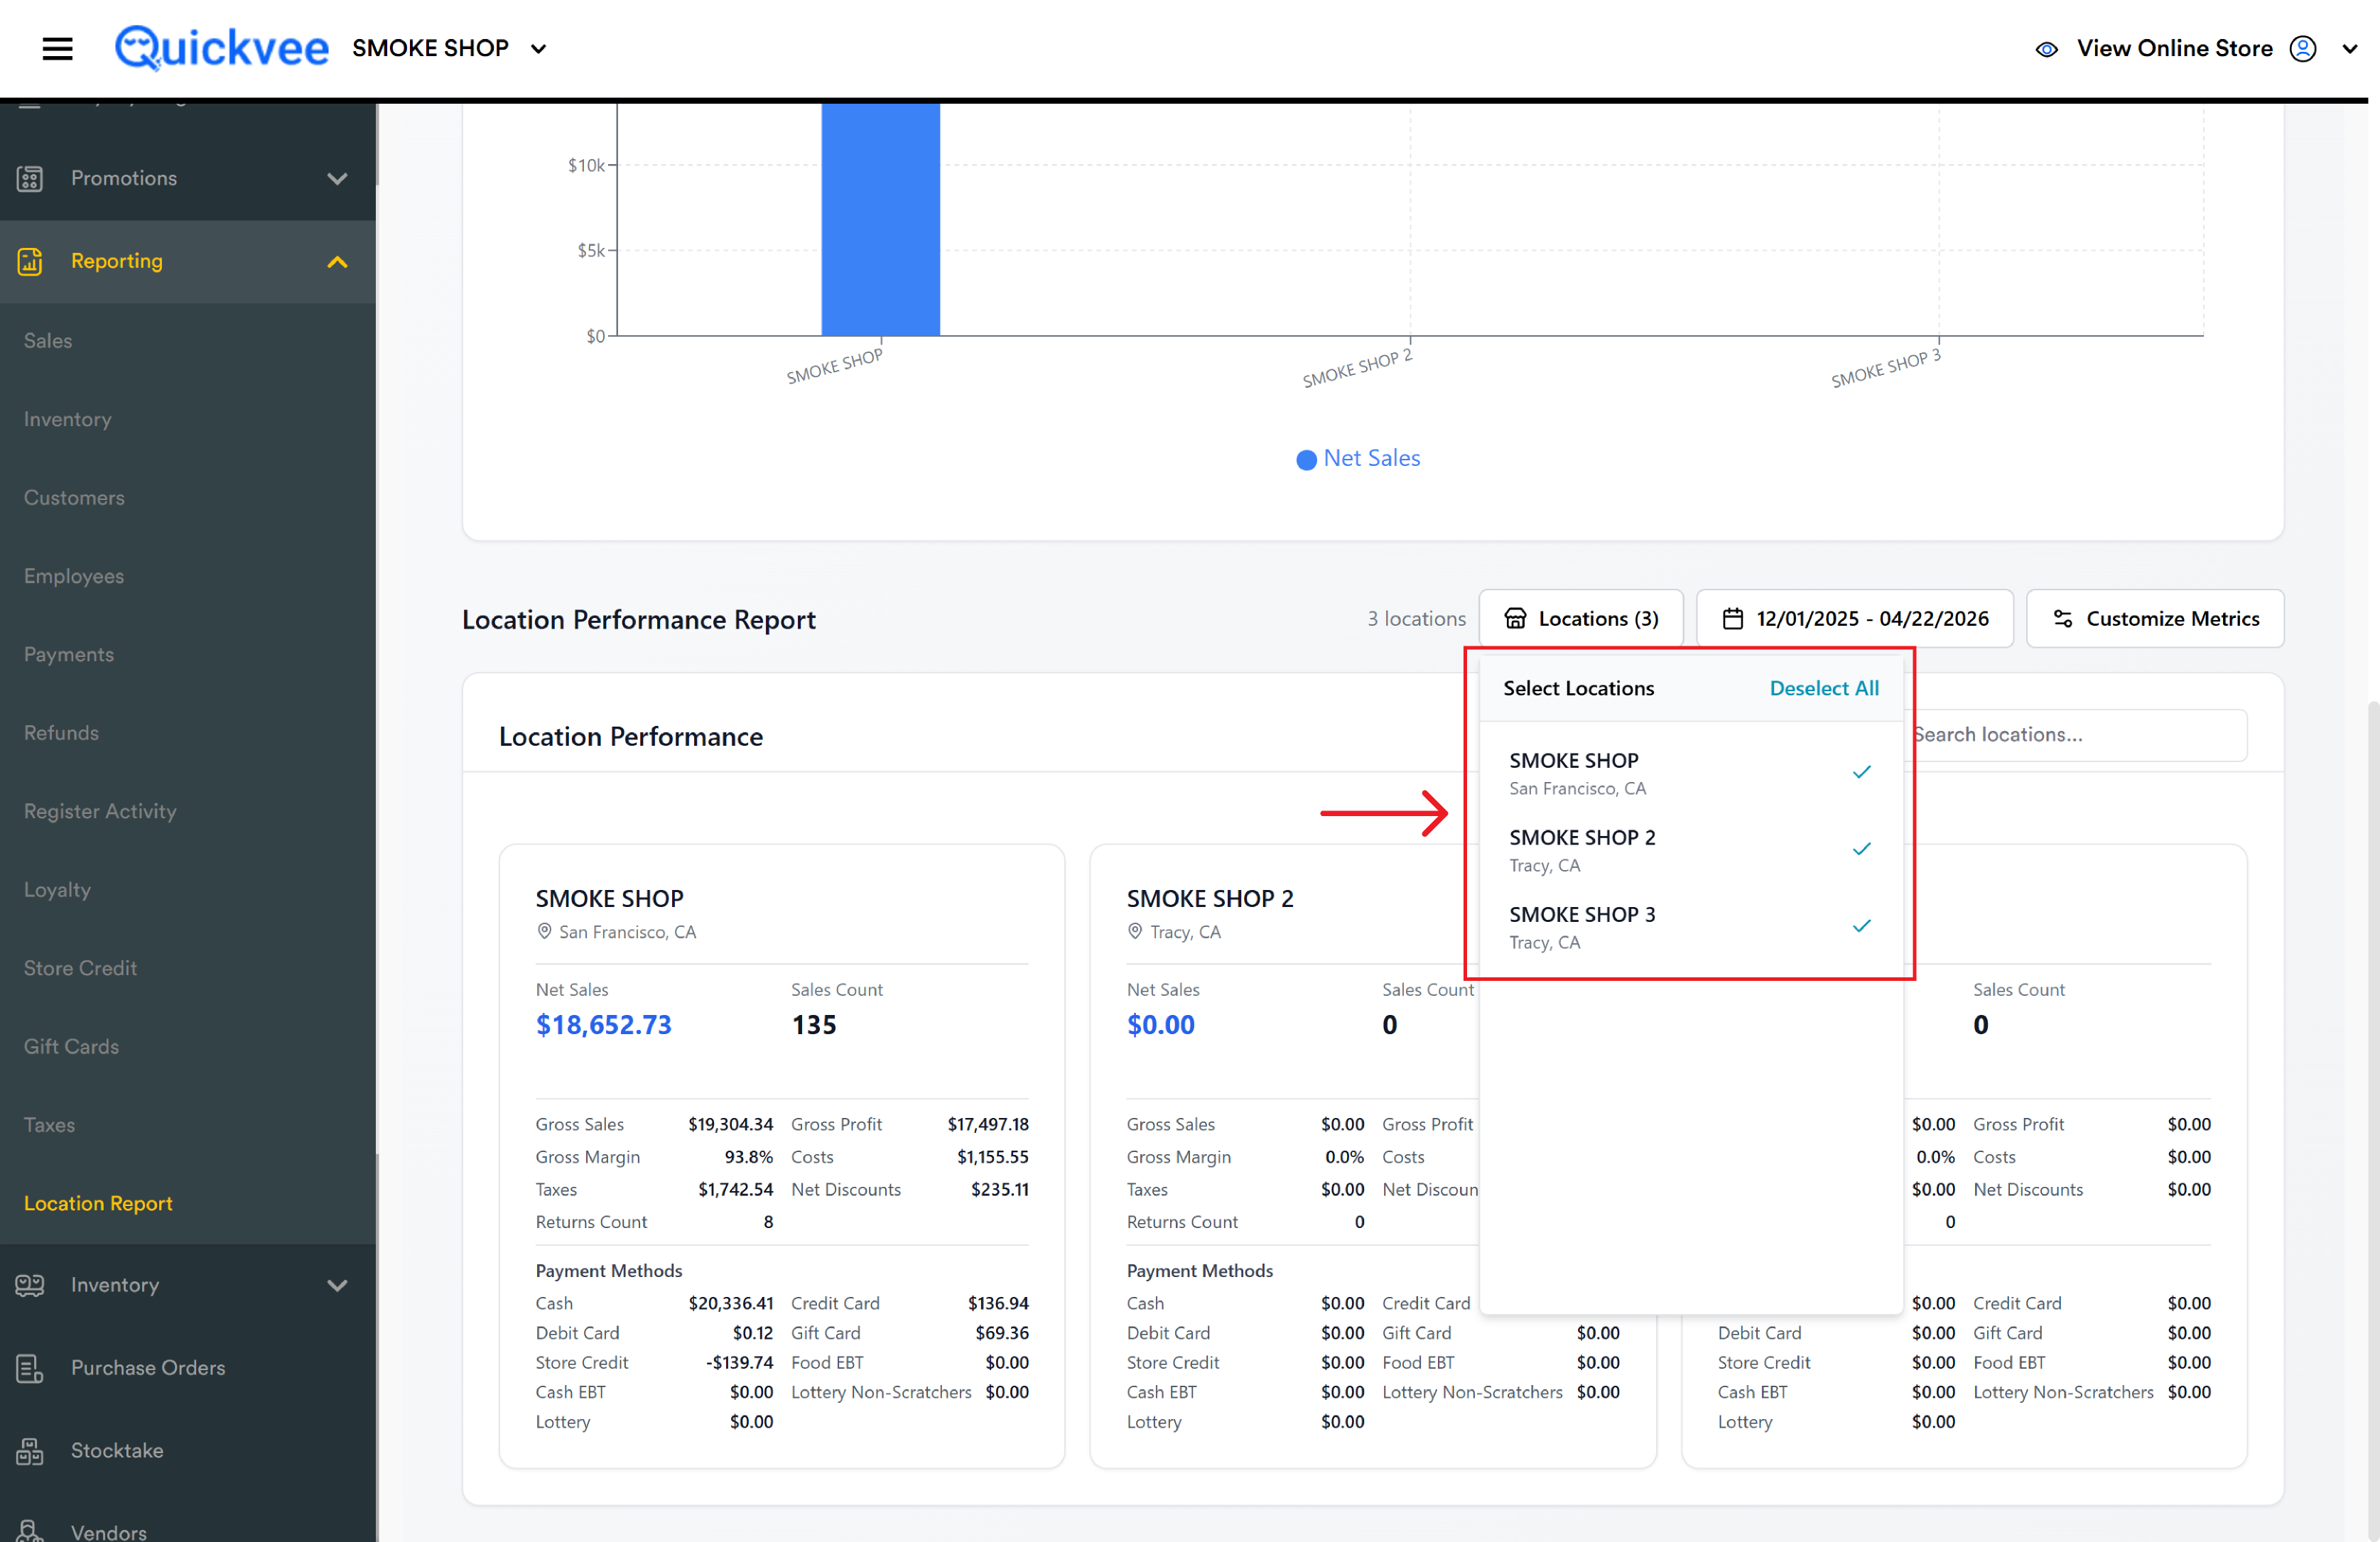
Click outside the panel when done. The page recalculates.
Permissions apply. Limited users (managers with access to a subset of stores) only see the stores they have access to. Super Admins see all stores.
Every other number on the page is computed from the locations you've ticked. A single-store manager won't see "all locations" here; only their own.
Step 2 — Set the date range
Click the date-range button (shows the currently selected dates). A calendar panel opens with two areas: the date picker on the left and a preset column on the right.
Preset options (fastest way)
|
Preset |
Covers |
|---|---|
|
Today |
Today only |
|
Yesterday |
The previous calendar day |
|
Week-to-date |
From start of this week (Monday) through today |
|
Last week |
The entire previous week, Monday through Sunday |
|
Last 7 days |
Today plus the 6 days before it |
|
Month-to-date |
From the 1st of this month through today |
|
Last month |
The entire previous calendar month |
|
Last 30 days |
Today plus the 29 days before it |
|
This year |
From January 1 of this year through today |
|
Last year |
The entire previous calendar year |
Custom range
If no preset covers what you need, type Start Date and End Date directly, or use the calendar grid with month navigation arrows.
Custom business day vs calendar day
Below the Start/End fields is a pair of radio buttons that quietly control something important:
-
Use custom business day start time — a "day" runs from your store's business-day start (often 4 AM or 6 AM) to the same time the next day. Sales rung up at 1 AM belong to the previous business day. Use this for reports that match how your shifts close.
-
Use calendar day starting at 12 AM — a "day" is the calendar day from midnight to midnight. Use this for tax periods, banking dates, or anything tied to the calendar.
Click Retrieve to apply the date range. Cancel closes the panel without changing anything.
Your custom business-day start time is configured under store settings. The toggle here just chooses which clock to use.
Step 3 — (Optional) Customize which metrics show
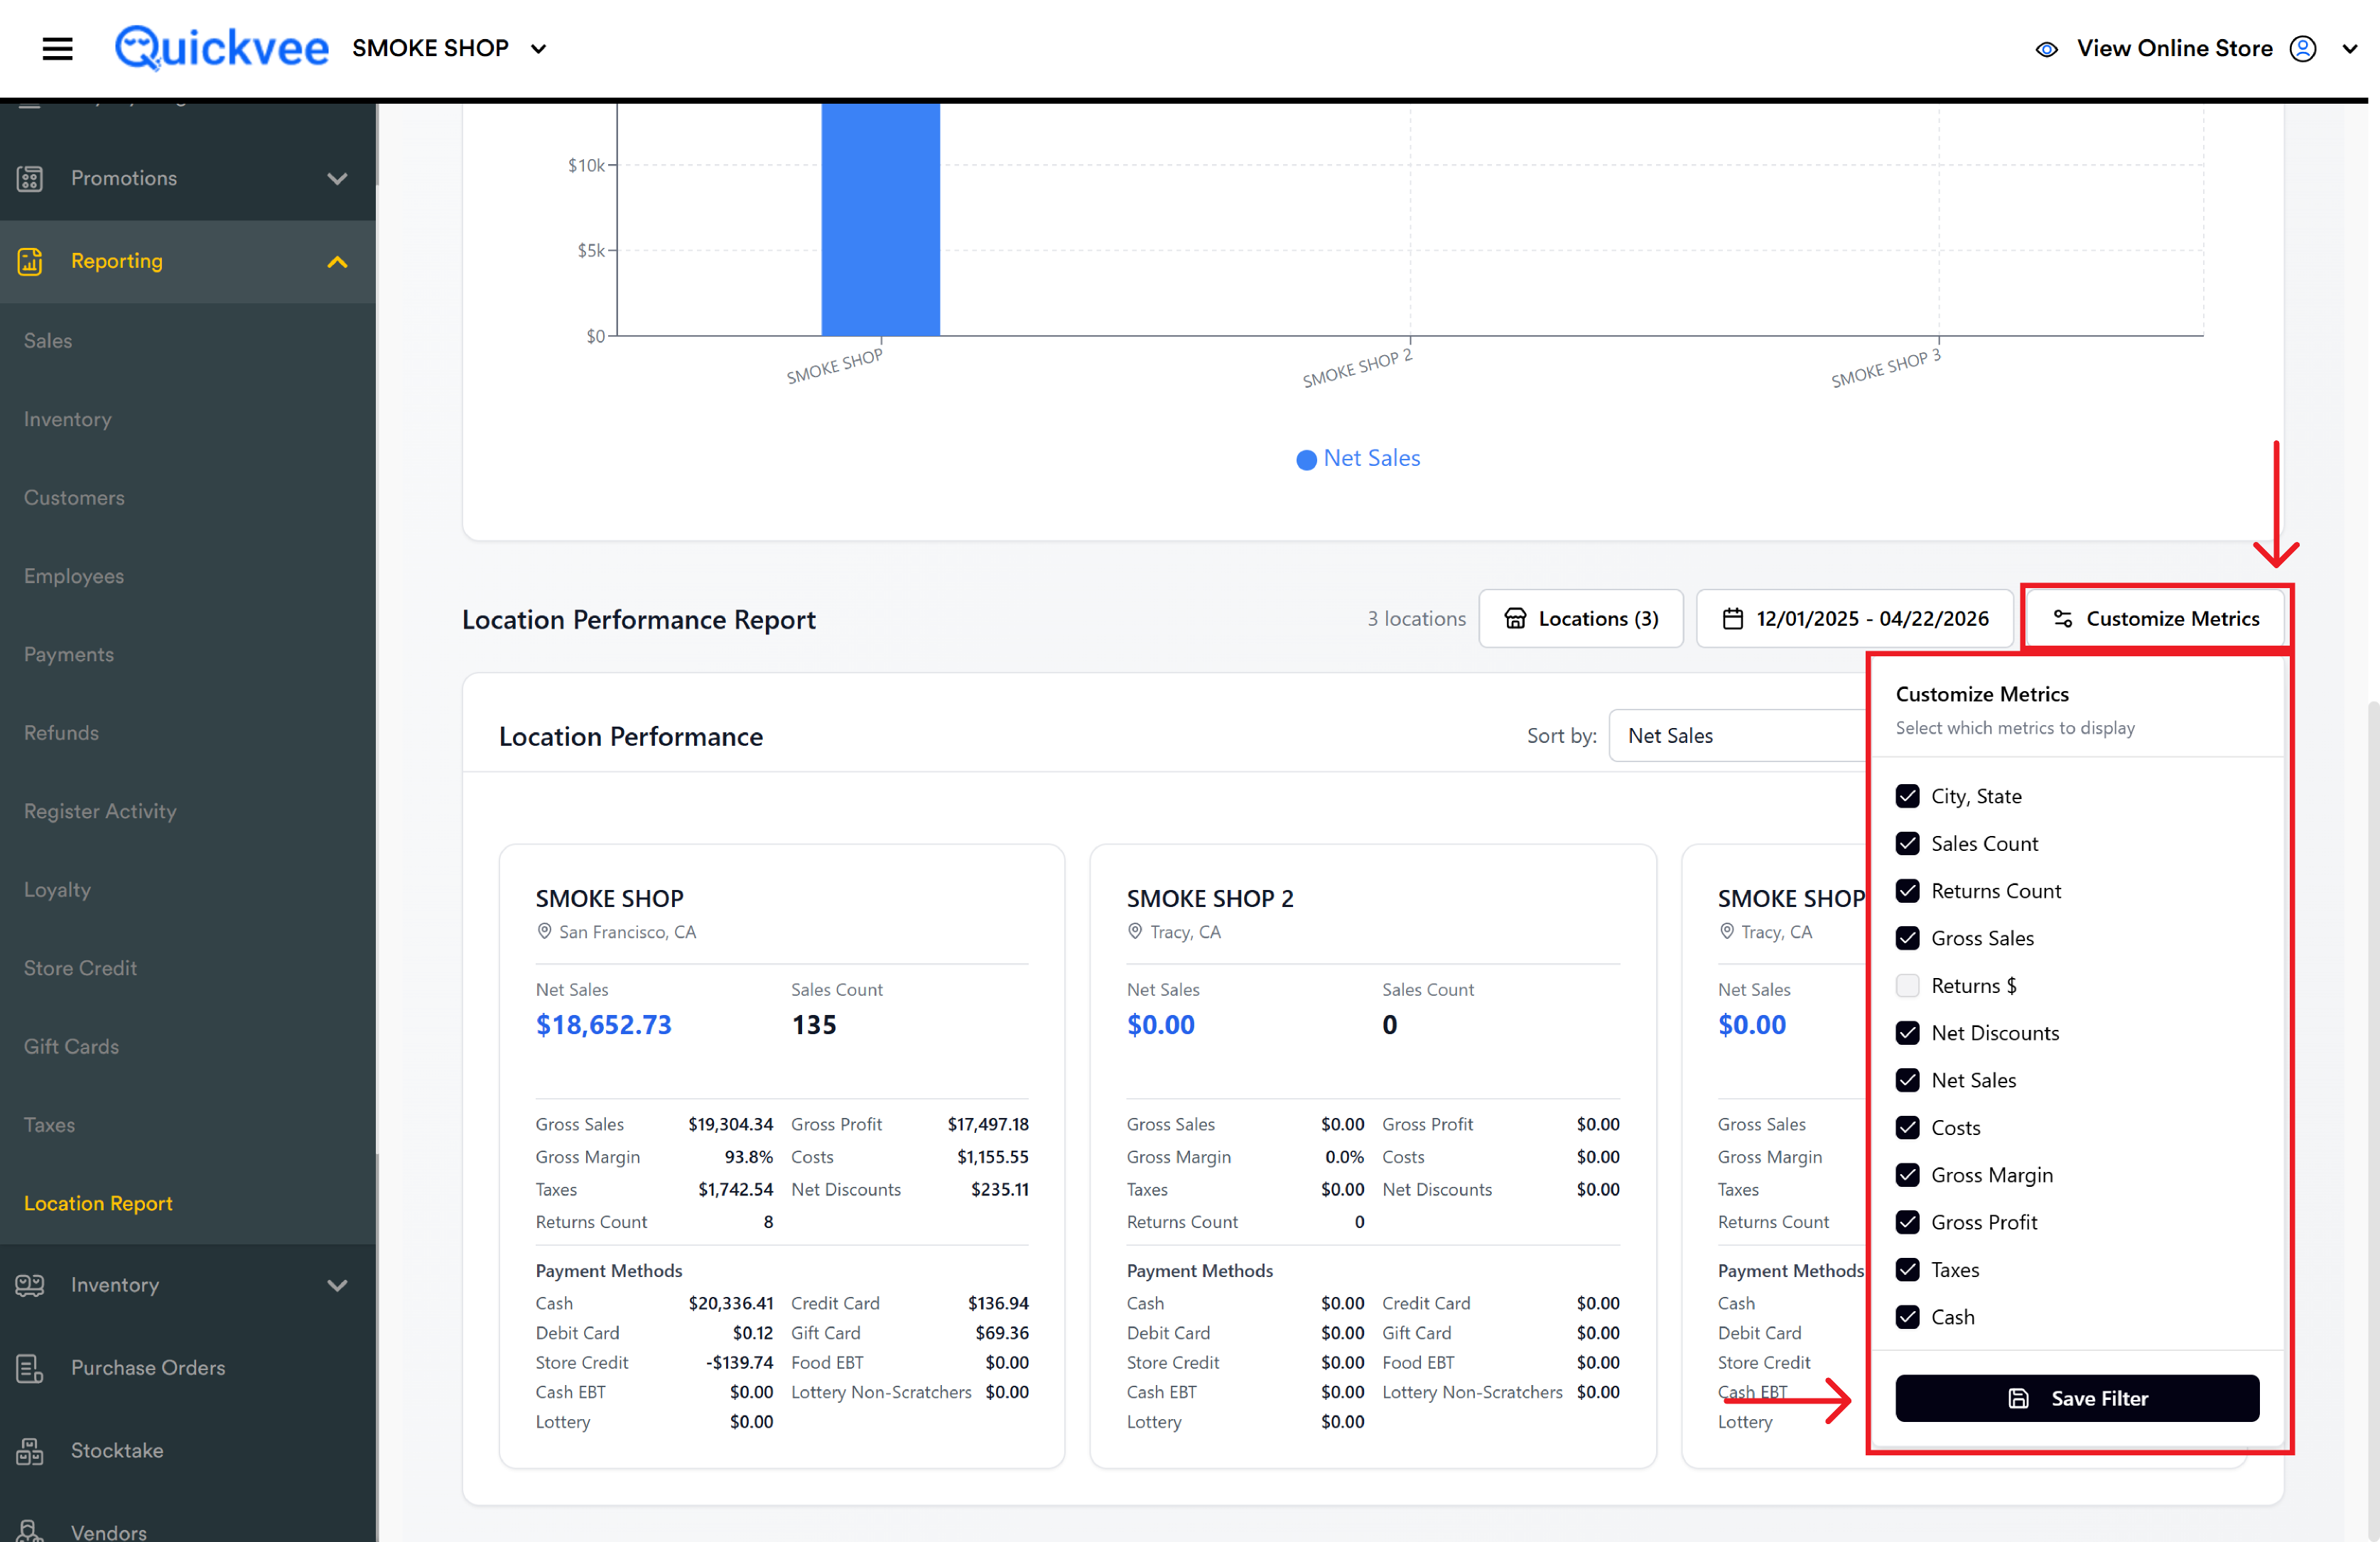
Click Customize Metrics to choose which data points each location card displays. Available metrics:
-
City, State
-
Sales Count
-
Returns Count
-
Gross Sales
-
Returns $
-
Net Discounts
-
Net Sales
-
Costs
-
Gross Margin
-
Gross Profit
-
Taxes
-
Cash
Tick what you want; untick what you don't. Cards update immediately.
Save filter / Load saved filter
-
Save Filter — stores the current combination (locations + date mode + metrics) for one-click reuse
-
Load Saved Filter — brings up a list of previously saved configurations
A saved filter captures the combination of location selection + metrics + preferences, so merchants who run the same view every Monday morning can load it with one click.
Step 4 — Read the overview metrics
The top block is the Total Overview card — every number is the sum of the locations you ticked.
Payment Methods
The Total Overview card has a dedicated Payment Methods block showing the dollar total collected in each tender across every selected store:
-
Cash
-
Credit Card
-
Debit Card
-
Gift Card
-
Store Credit
-
Food EBT
-
Cash EBT
-
Lottery Non-Scratchers
-
Lottery
One of the most practical uses of the report. A chain with 10 stores can see its total cash exposure across all stores in one line — useful for armored-pickup scheduling, daily deposit planning, and cash-handling audits.
Step 5 — Check Performance Analysis
The Top Locations bar chart shows your top performers on one metric at a time. A toggle in the top right switches the metric:
-
Net Sales — ranks locations by dollar revenue. Bars are blue.
-
Sales Count — ranks locations by transaction count. Bars are green.
Net Sales and Sales Count can produce different rankings. A store with big-ticket items may top Net Sales while having fewer transactions; a high-traffic convenience location may top Sales Count while ringing smaller average baskets. Comparing the two toggles side by side is a quick diagnostic.
Step 6 — Review each location individually
The Location Performance section shows one card per selected location.
Controls
-
Sort by dropdown — default is Net Sales (highest first). Other options: Sales Count, Gross Profit, etc.
-
Search locations — filter cards by store name
What each location card contains
Header — Store name, city, state
Headline metrics (top of card) — Net Sales (big blue number), Sales Count (big number)
Secondary metrics — Gross Sales, Gross Profit, Gross Margin, Costs, Taxes, Net Discounts, Returns Count
Payment Methods breakdown — Cash, Credit Card, Debit Card, Gift Card, Store Credit, Food EBT, Cash EBT, Lottery Non-Scratchers, Lottery
The per-store Payment Methods breakdown is where variance shows up first. If one location runs mostly cash while the rest run mostly card, that's a signal — sometimes demographic, sometimes a broken card reader.
Step 7 — (Optional) Export to Excel
Click Export to Excel in the top right to download the current view as a spreadsheet. The export respects your current selections — only the ticked locations, the set date range, and the chosen metrics.
Use this when you need to:
-
Share results with an accountant or business partner who doesn't have backend access
-
Cross-reference with bank deposits or tax filings
-
Build a pivot table for custom analysis
Common questions
The Location Report is empty even though I had sales today
Three things to check, in order: (1) the Locations selector has stores ticked — if you deselected everything, the page is technically working but has nothing to show; (2) the date range covers when the sales happened; (3) whether you're in business day or calendar day mode — a sale at 1 AM might fall on the "previous day" in business-day mode.
Why do my numbers here not match my Sales Summary report?
Two common causes. Business day vs calendar day — if one report is in business-day mode and the other in calendar-day mode, sales crossing midnight land on different dates. Location scope — Location Report only includes ticked stores; Sales Summary may be filtered differently. Align the date mode and location selection and the totals will match.
Why does Gross Profit show lower than I expected?
Gross Profit subtracts the cost of goods sold. If product cost data isn't fully entered (some products have $0 cost or missing costs), Gross Profit may look artificially high for those products; if costs are inflated or mismatched UPCs span locations, Gross Profit can look artificially low. Audit Costs on the Overview card — if it looks wrong there, it's wrong upstream in your product catalog.
I saved a filter but can't find it
Click Customize Metrics → Load Saved Filter. Saved filters are stored per user account, so if saved on a different login, you won't see it here.
Can I see online orders in this report?
Online order data is included in the aggregated totals — Net Sales, Gross Sales, Sales Count, Payment Methods all include online. If you want to separate online pickup vs delivery specifically, use the dedicated Sales reports.
A location I expect to see isn't in the selector
The selector only shows stores your login has permission to view. If you're a store manager with access to three of ten stores, seven won't appear. Have the account owner check your permissions.
The page loaded but the numbers are showing shaded rectangles
That's the skeleton loading state — the numbers are being calculated. Give it a few seconds, especially with many locations over a wide date range. If it stays shaded after 30 seconds, narrow the date range.
Can I schedule this report to email me?
Not in the current release. Use Export to Excel manually when you need a snapshot.
Does this report include refunded orders?
Refunds reduce Net Sales and show up in Returns Count. Gross Sales is the pre-return number, Net Sales is the post-return number. If Returns Count is non-zero, the difference between Gross and Net will reflect those returns (plus discounts).