
The Employee Sales Summary is the team scoreboard. One row per cashier, one column per money metric — Net Sales, Cost of Goods Sold, Gross Profit, Margin %, and Tax — for the date range and outlet you choose. It's the report you pull up first thing every morning to see how yesterday closed across the team, and the report you export at the end of every pay period to drive commission and bonus calculations.
Where Sales by Item per Employee and Sales by Category per Employee drill into what each cashier sold, Employee Sales Summary stays at the top — it tells you the totals each cashier delivered, without going into product or category mix.
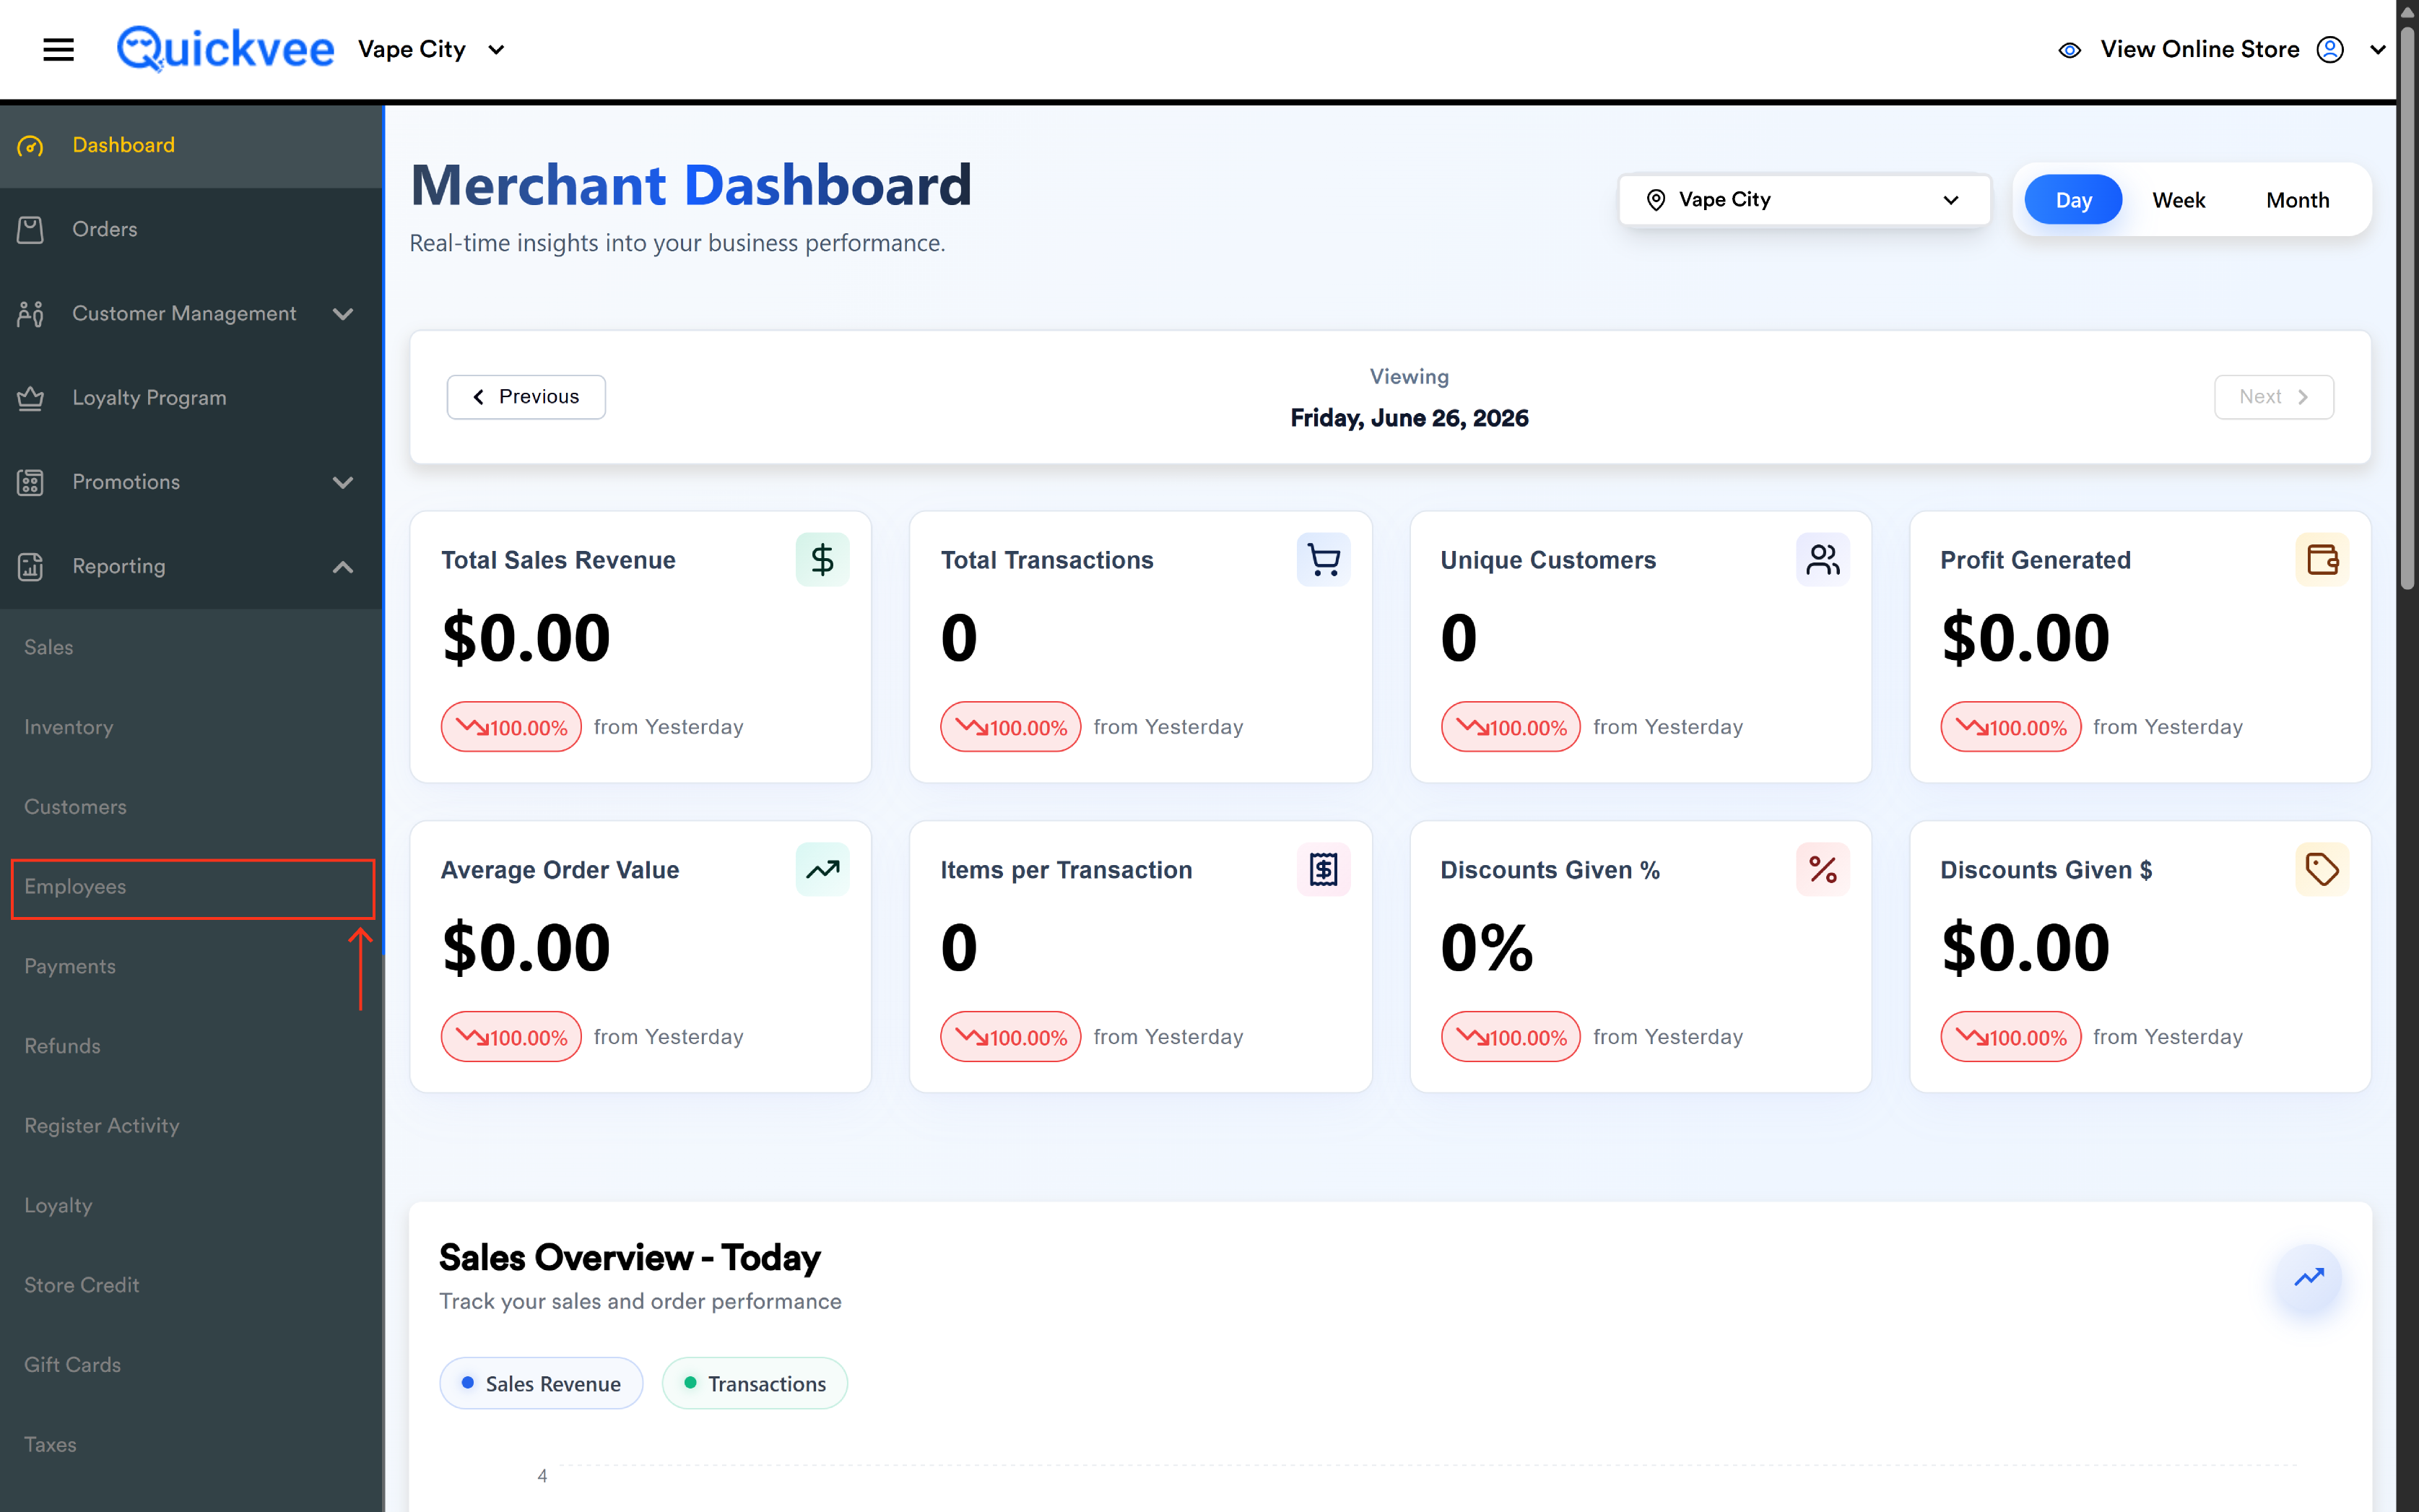
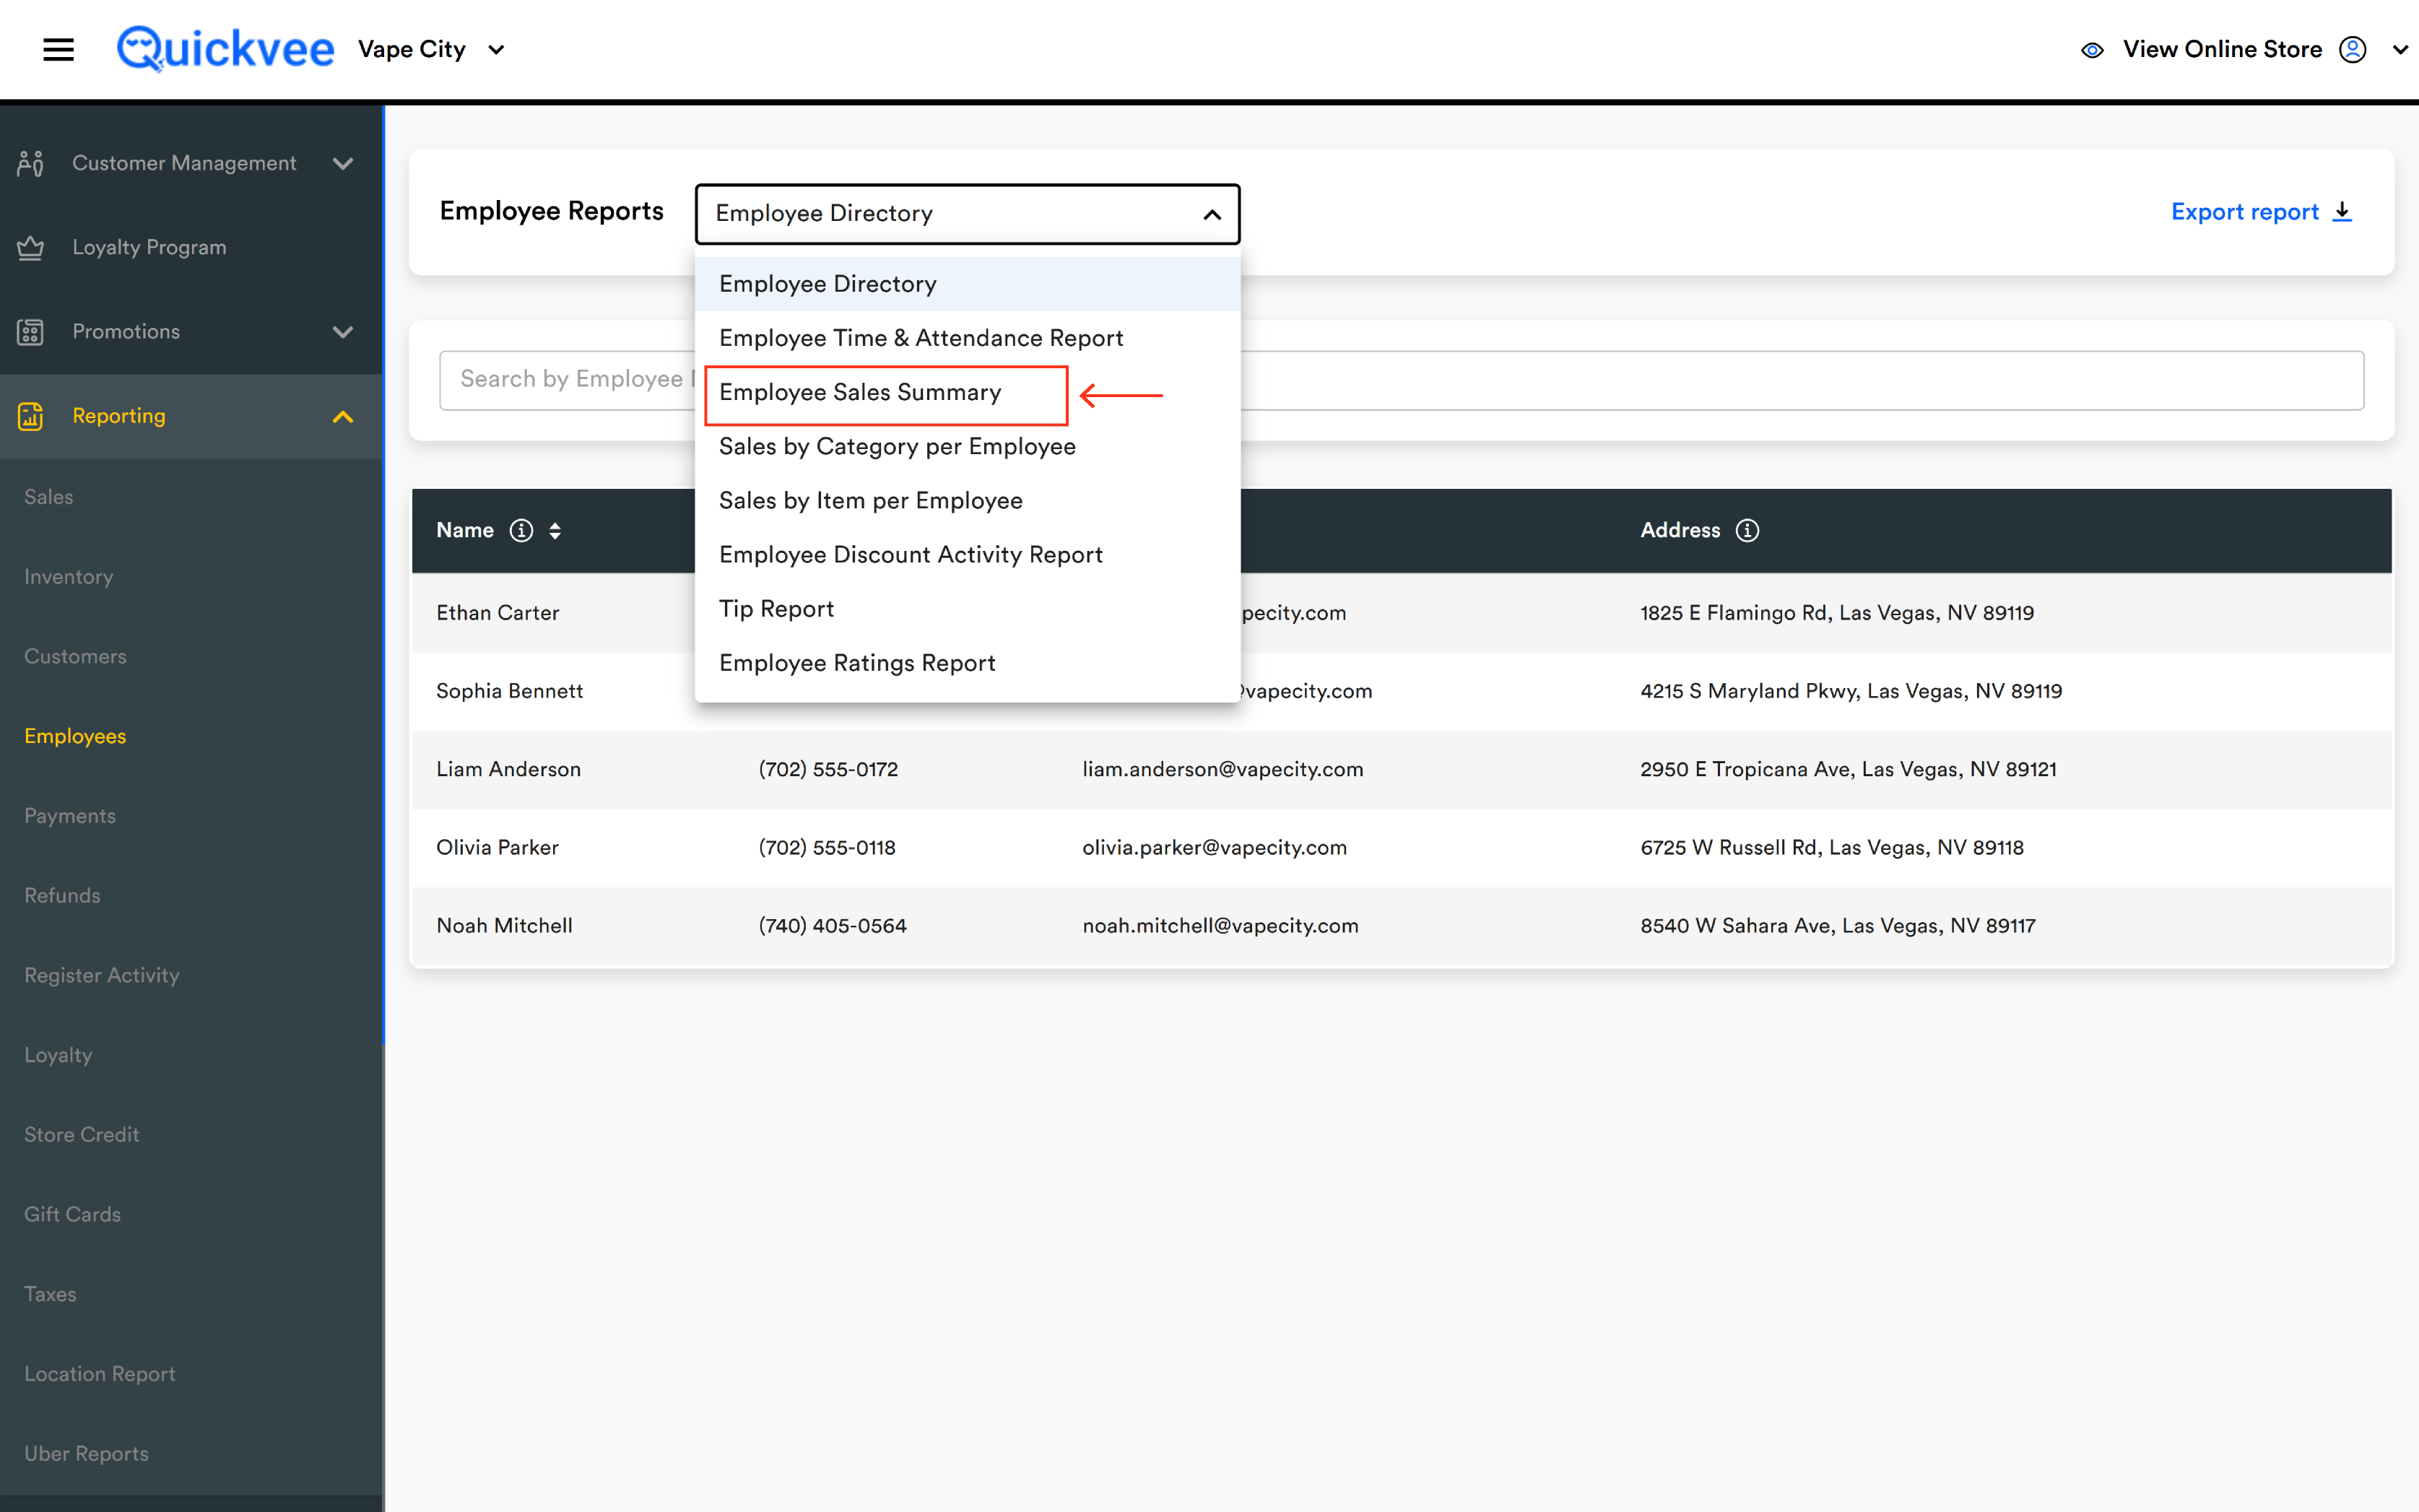
Access path: Sign in to your merchant backend → side menu → Reporting → Employees → and from the Employee Reports dropdown at the top of the page select Employee Sales Summary.
-20260626-153043.png?cb=990f418ab00bd842c7a0fc455510ec00)
Running the report
Filter By
|
Filter |
What it does |
|---|---|
|
Employee |
Dropdown to scope the report to a single employee. Leave unset to include every employee who made sales in the period. |
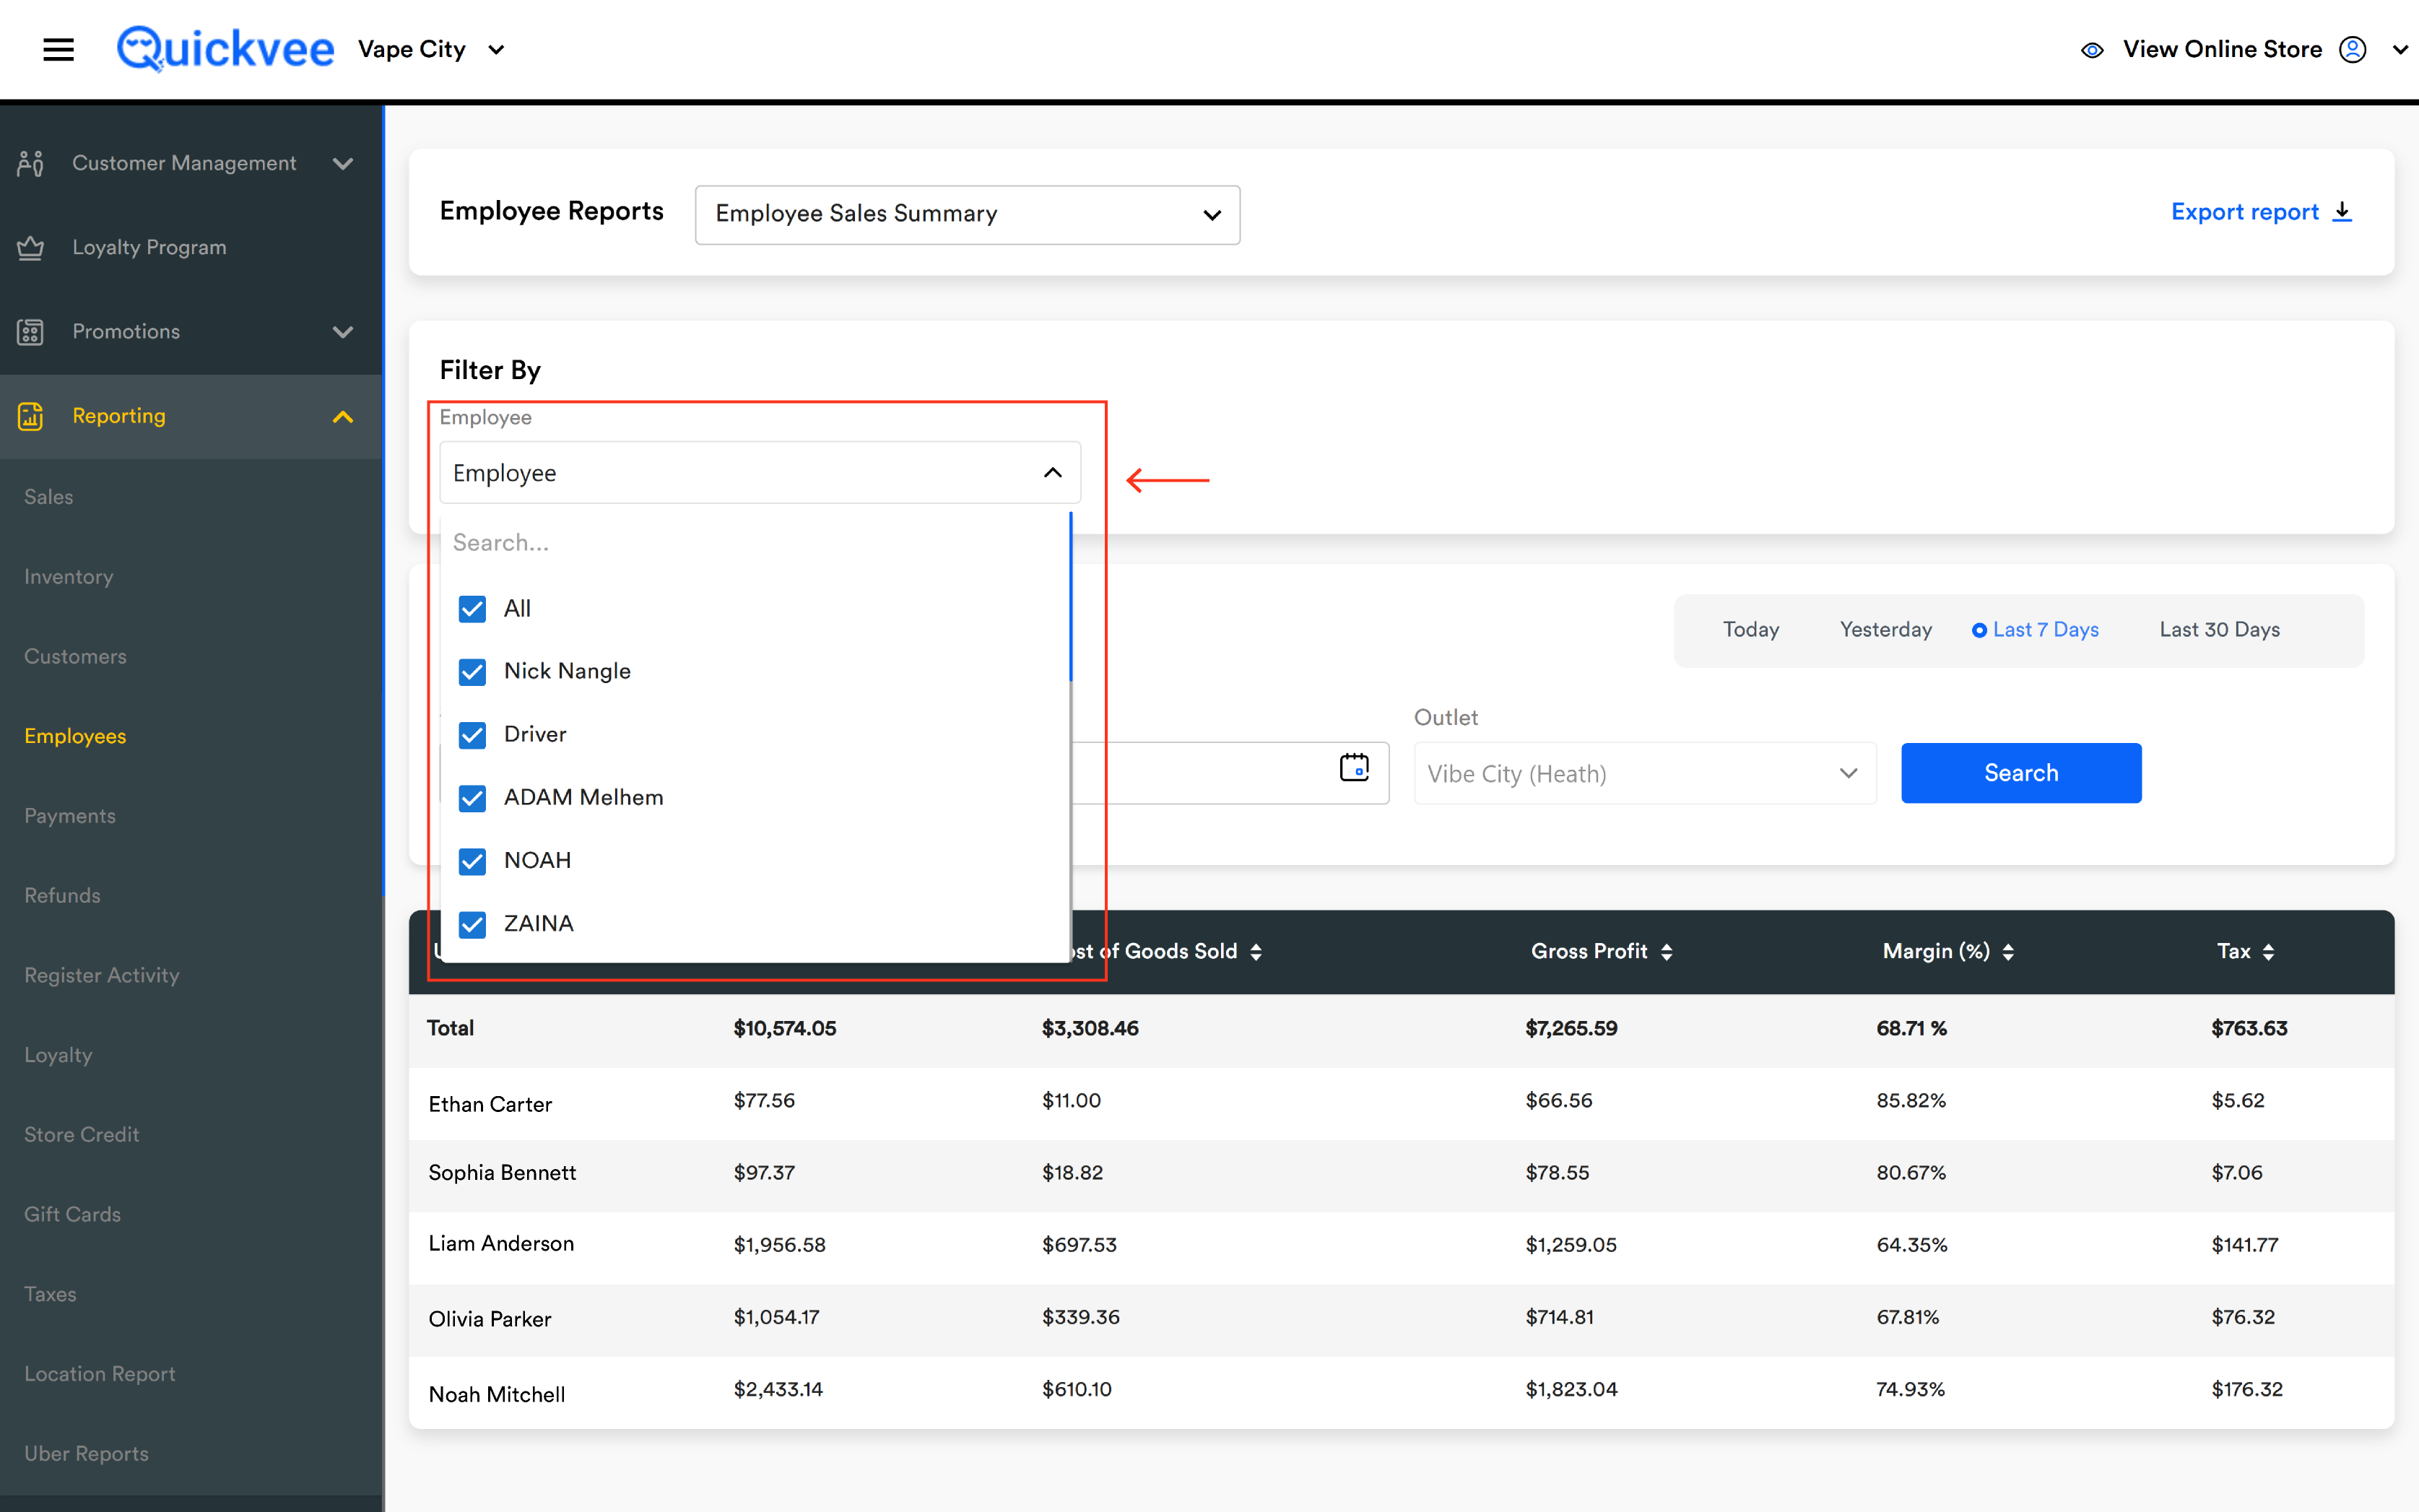
The Filter By panel is intentionally simple — only an Employee filter, because the report itself is already a one-row-per-employee summary. Use the filter when you need to isolate a single cashier for a one-on-one review.
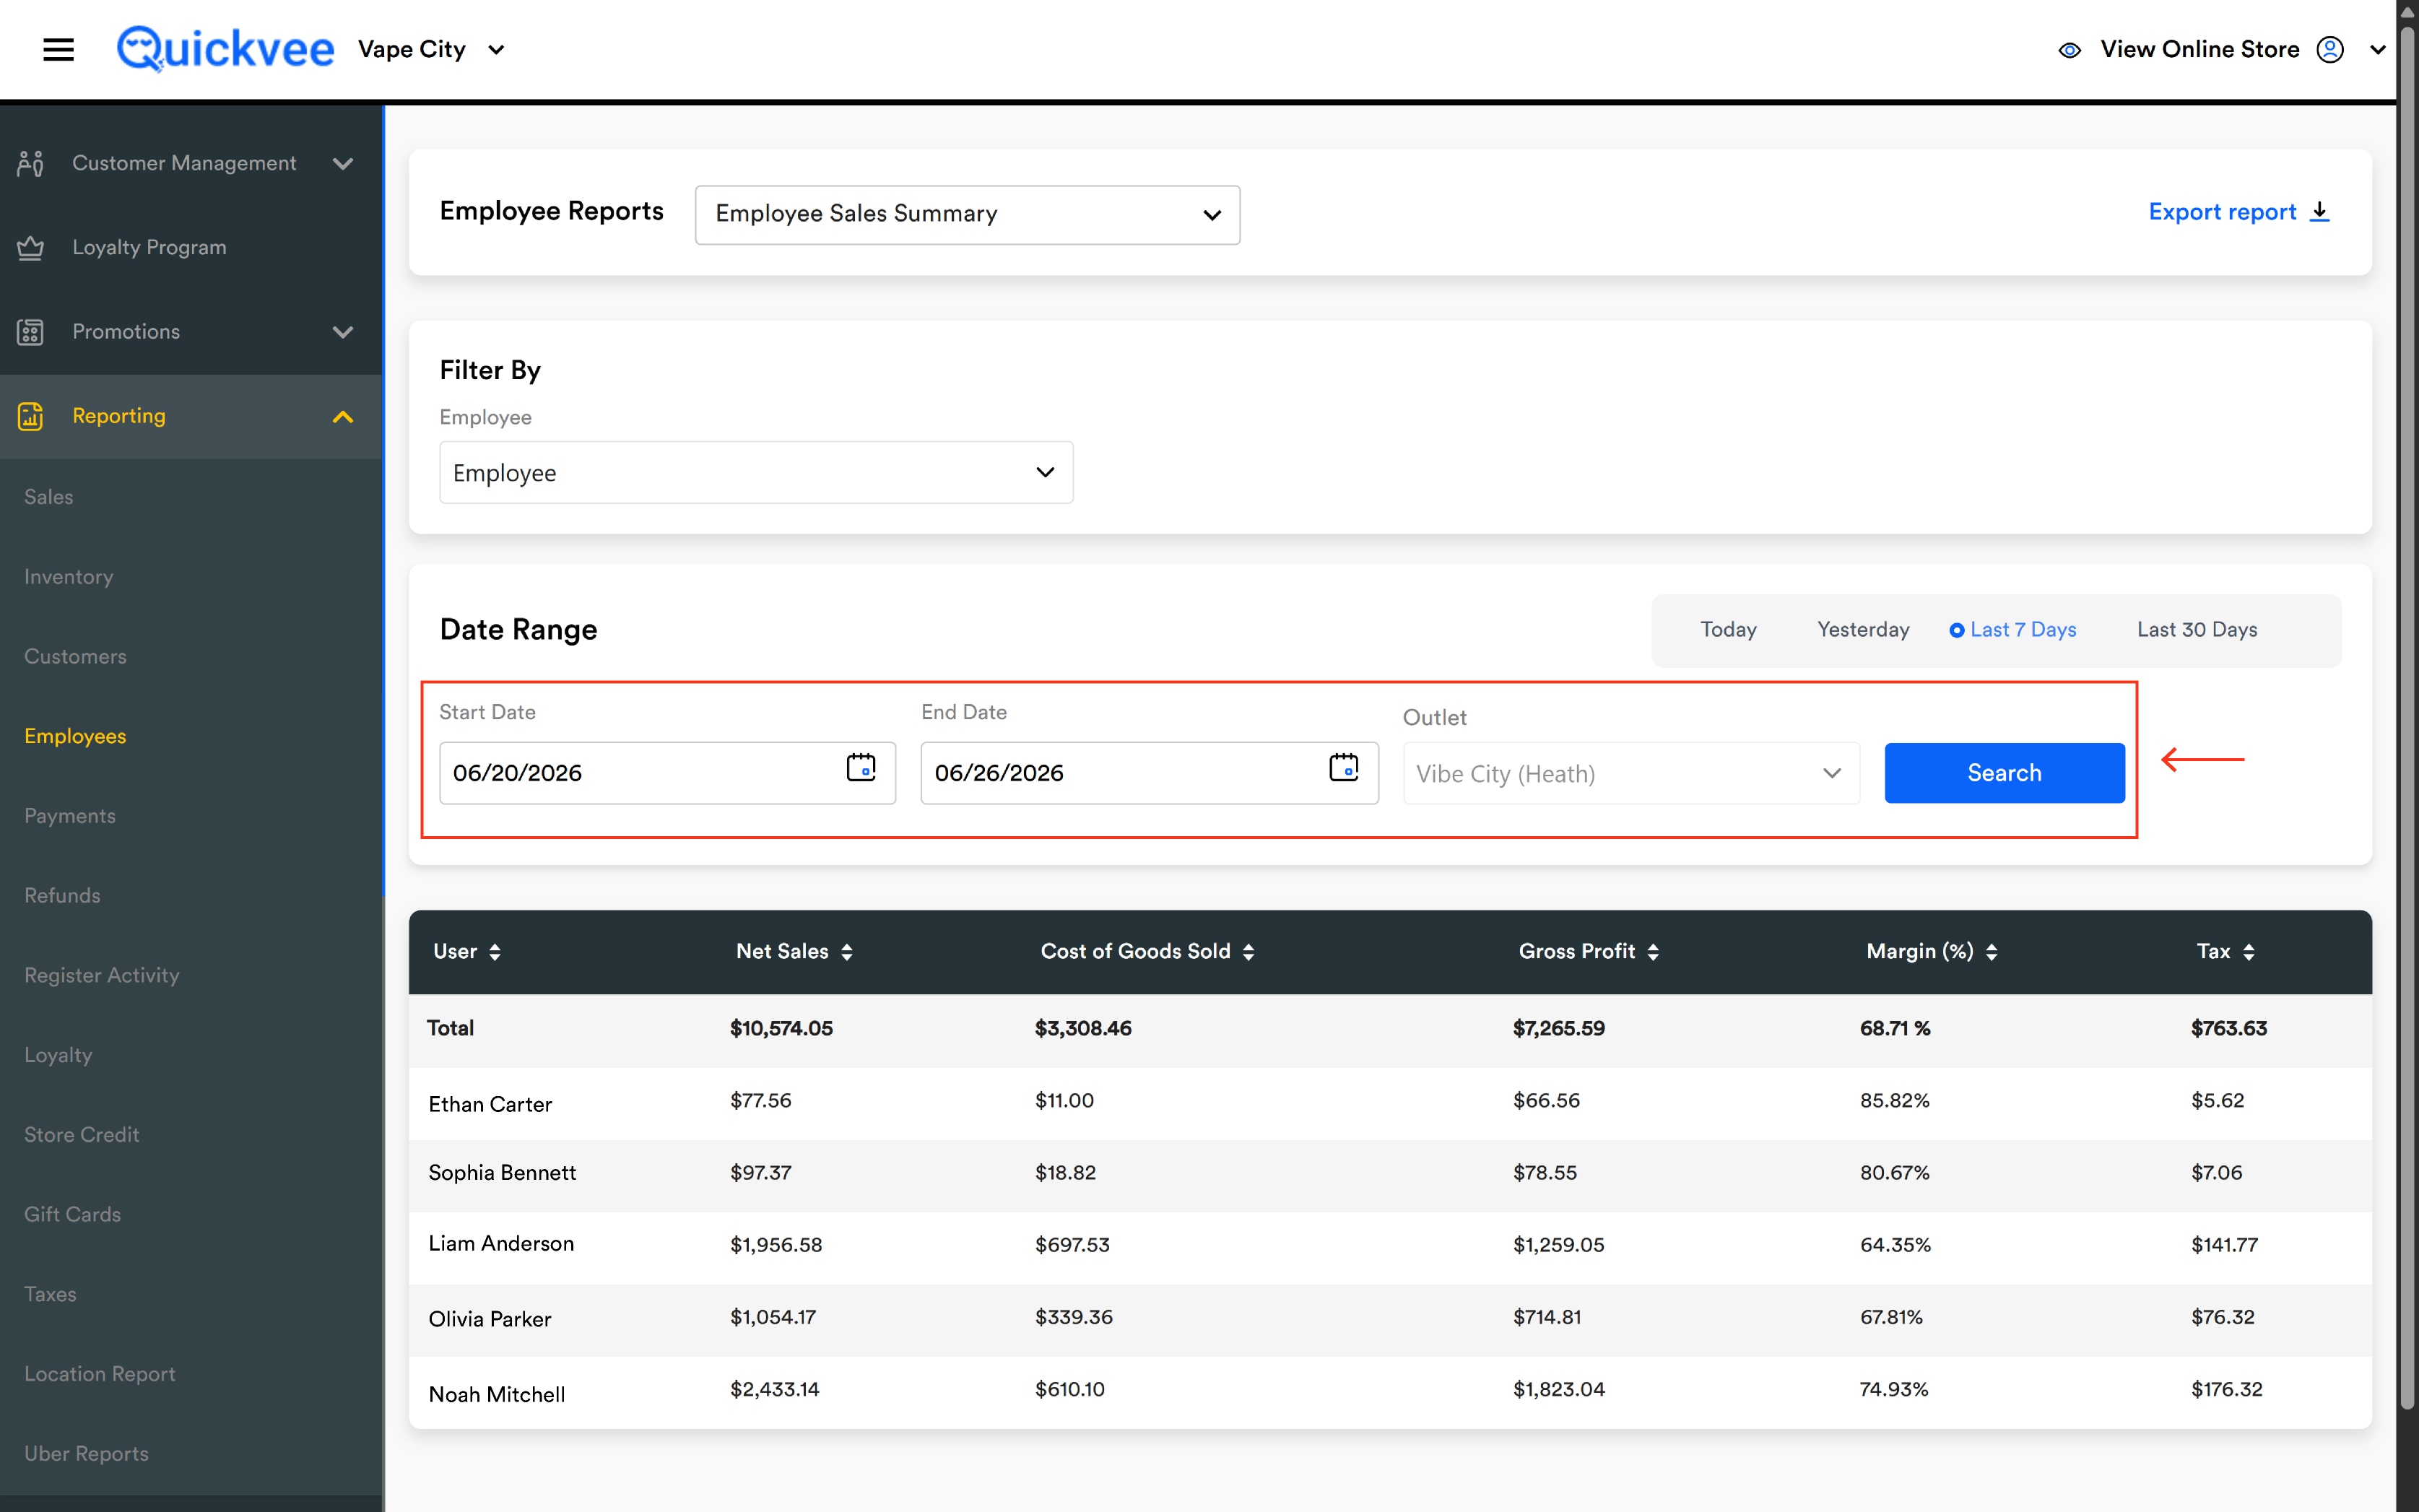
Date Range
|
Control |
What it does |
|---|---|
|
Start Date |
The first day of the date range. Calendar picker. |
|
End Date |
The last day of the date range. Calendar picker. |
|
Outlet |
When your account has more than one store location, the outlet dropdown picks which store the report runs against. |
|
Search (blue) |
Runs the report. |
Quick range buttons
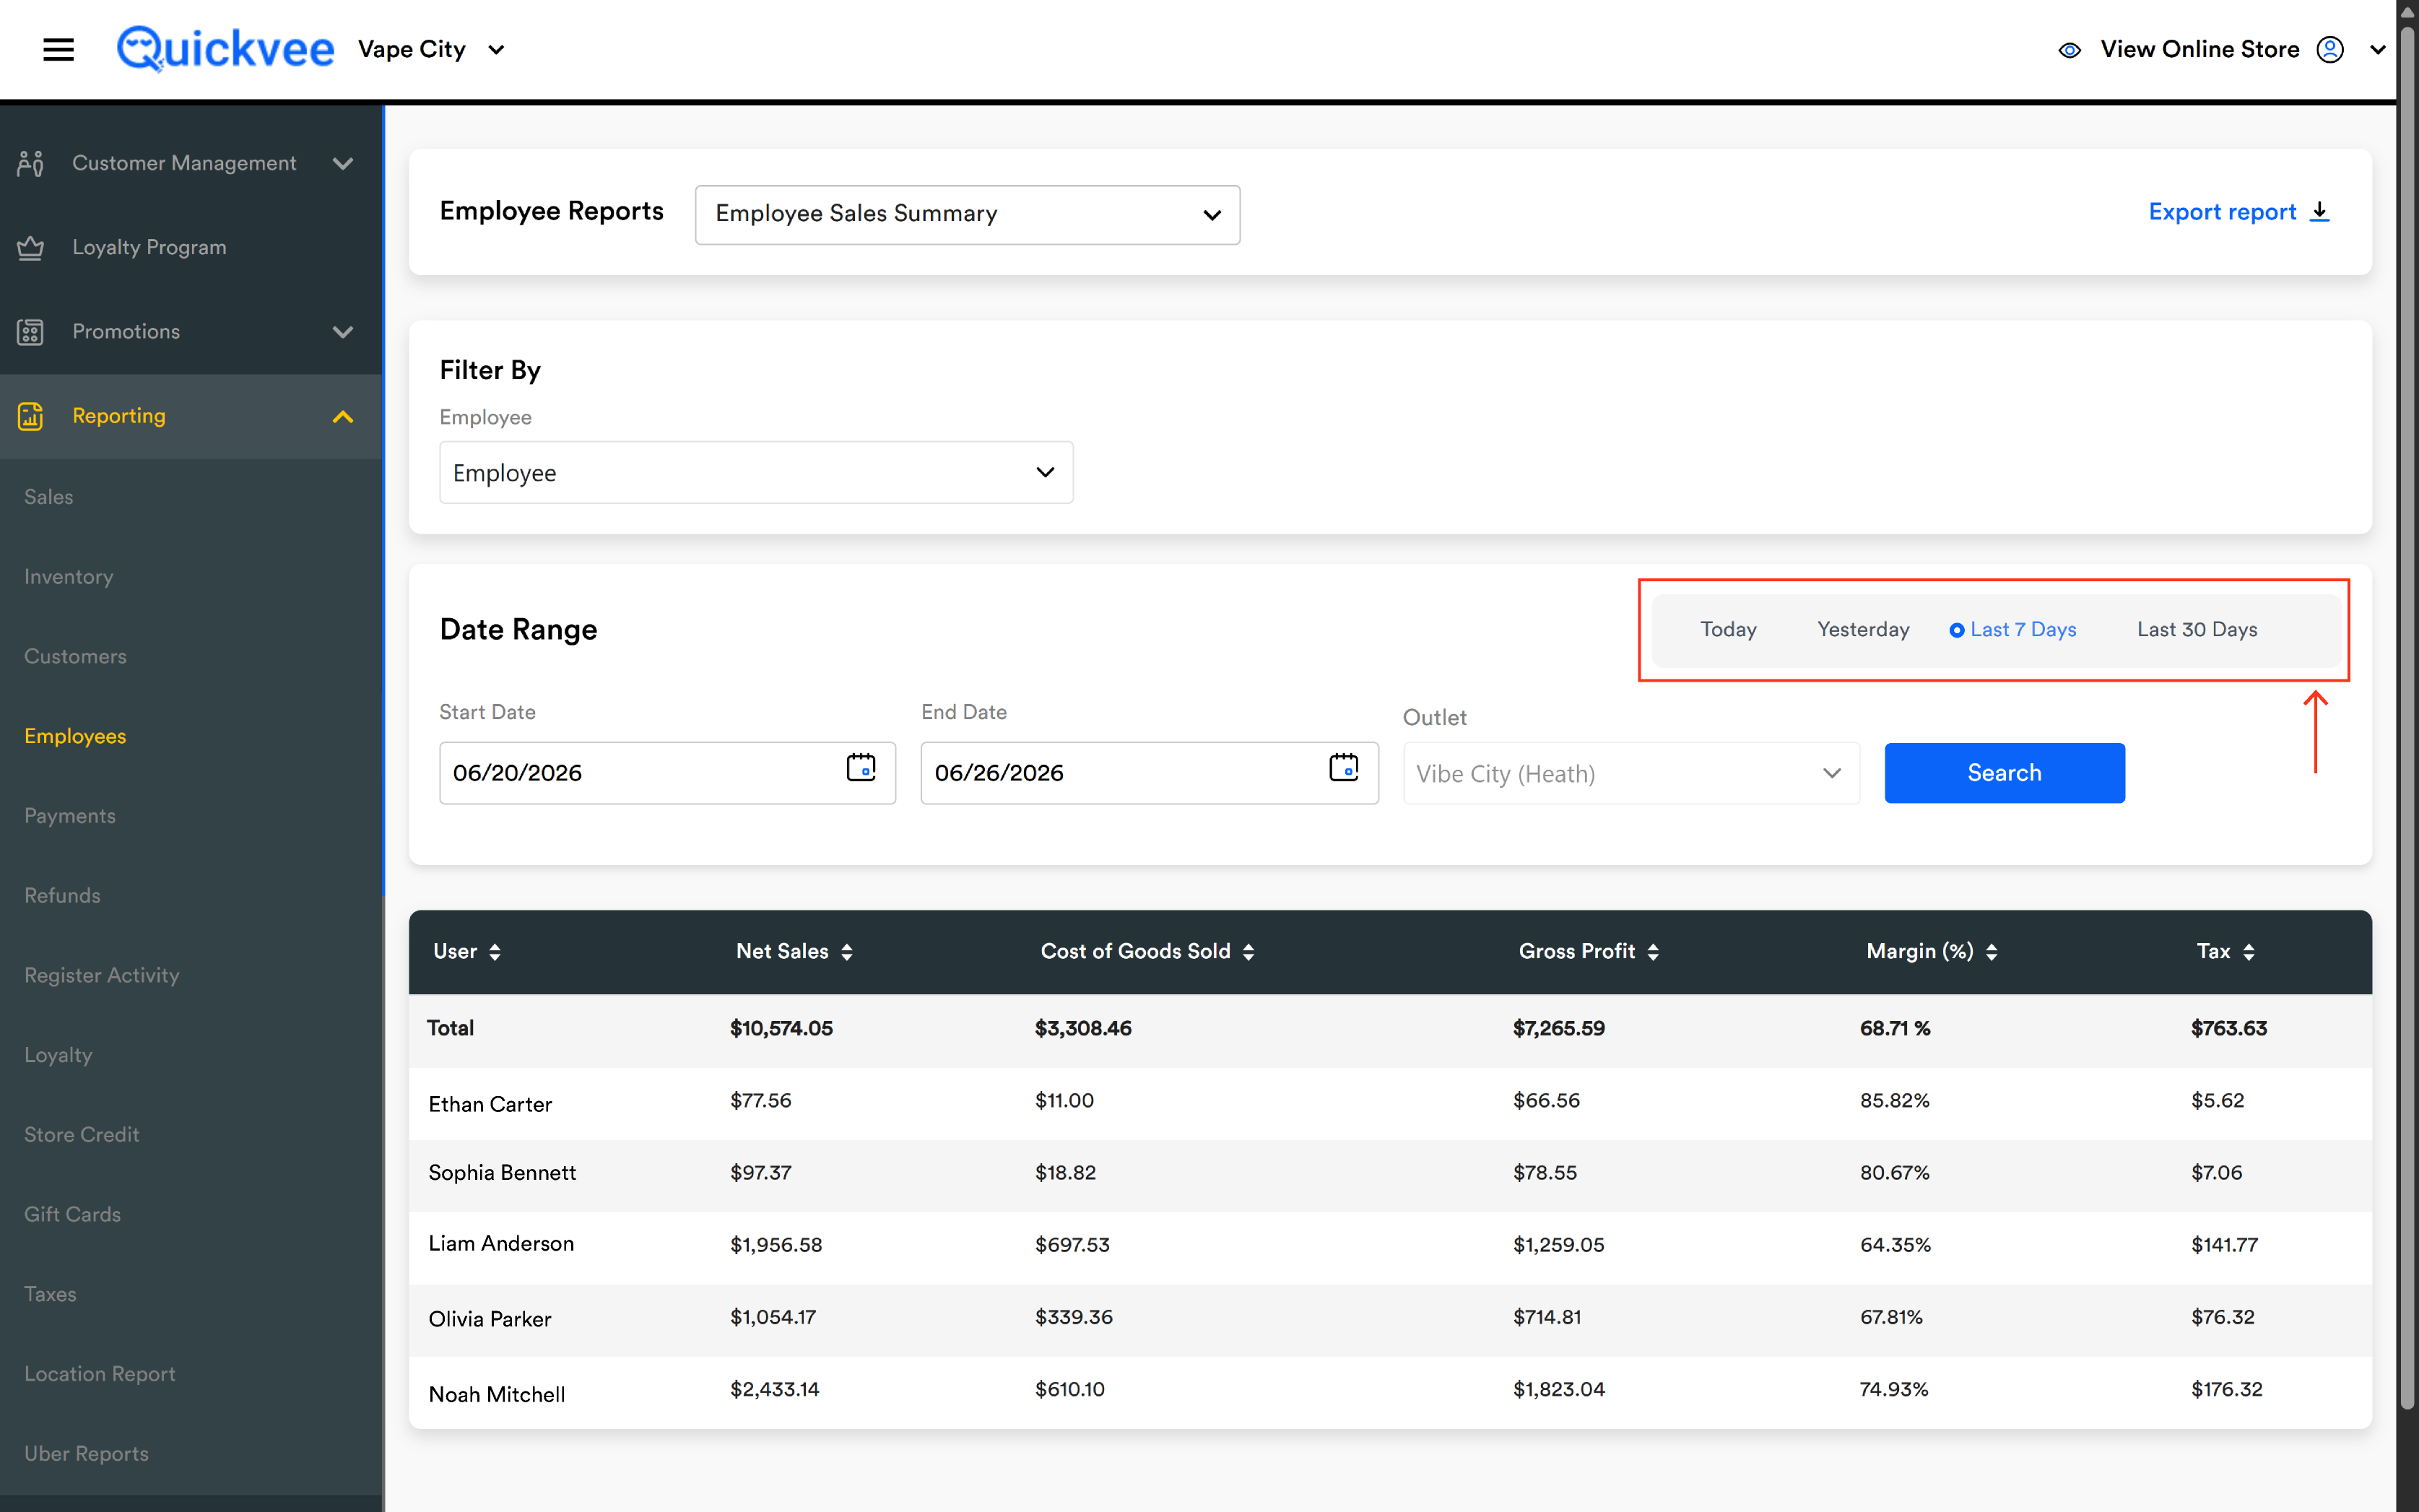
Four quick-range buttons let you skip the calendar picker: Today, Yesterday, Last 7 Days, Last 30 Days.
Export report
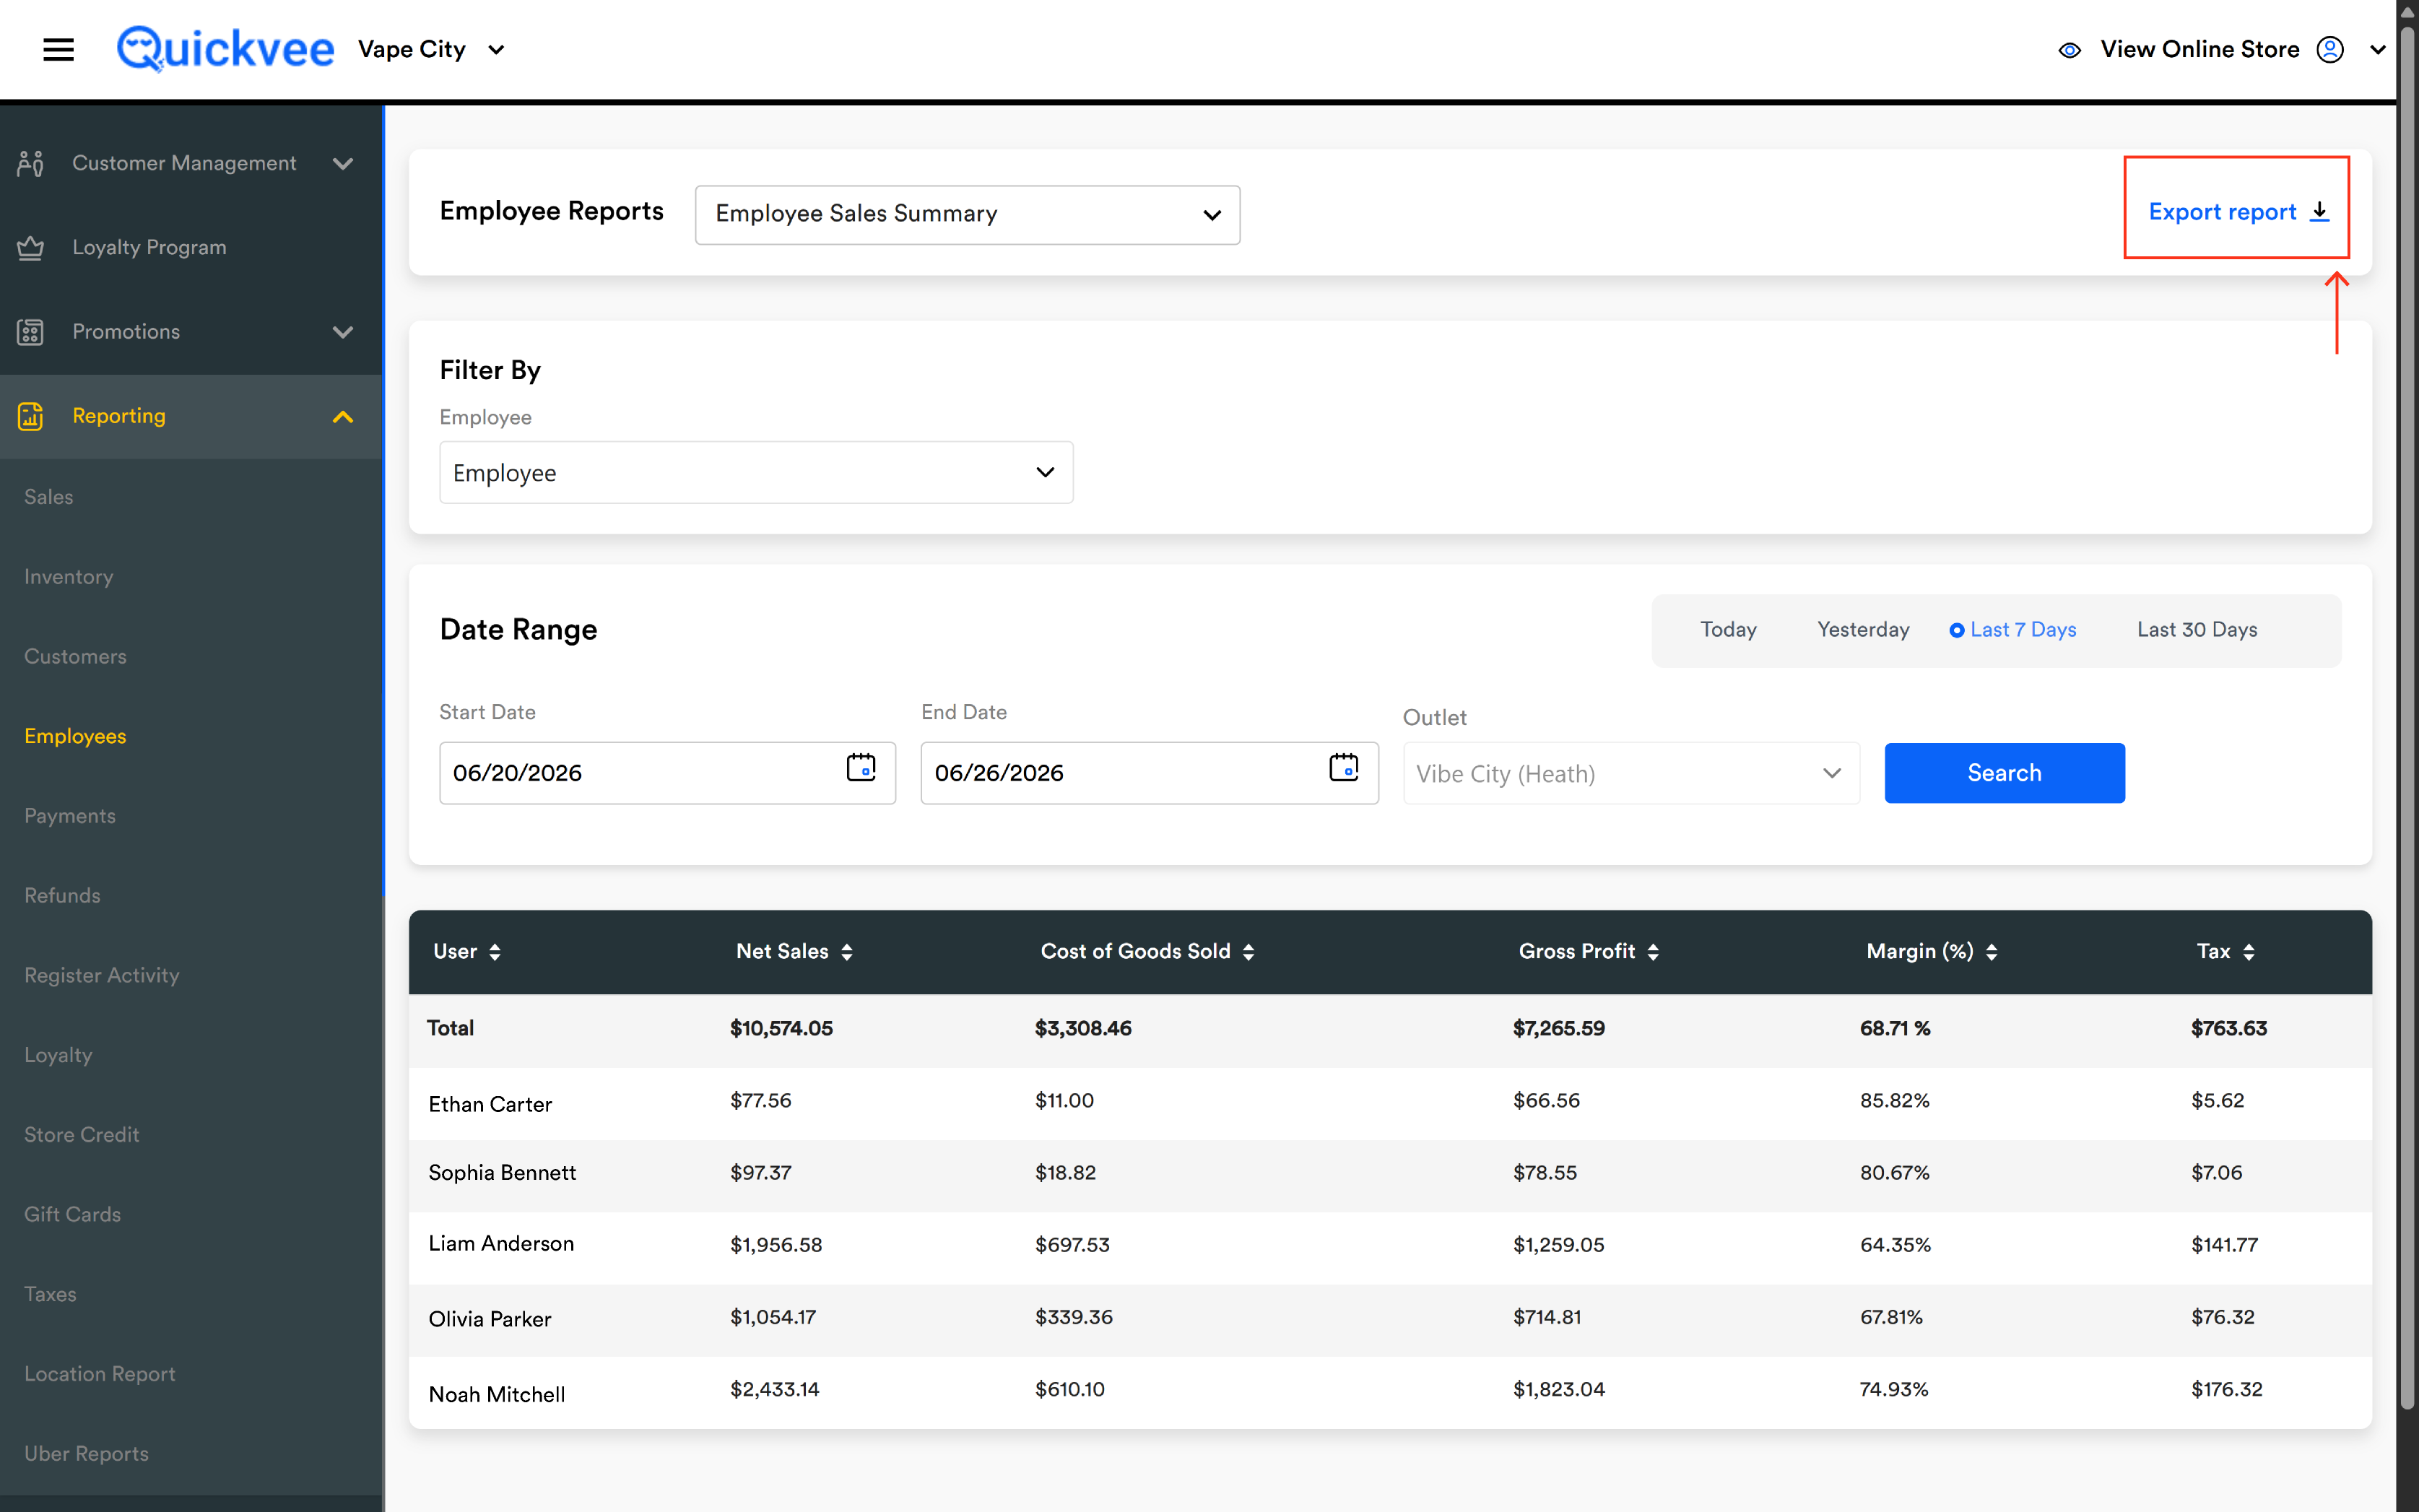
The Export report link at the top-right downloads every cashier row and the Total as a spreadsheet.
Reading the report
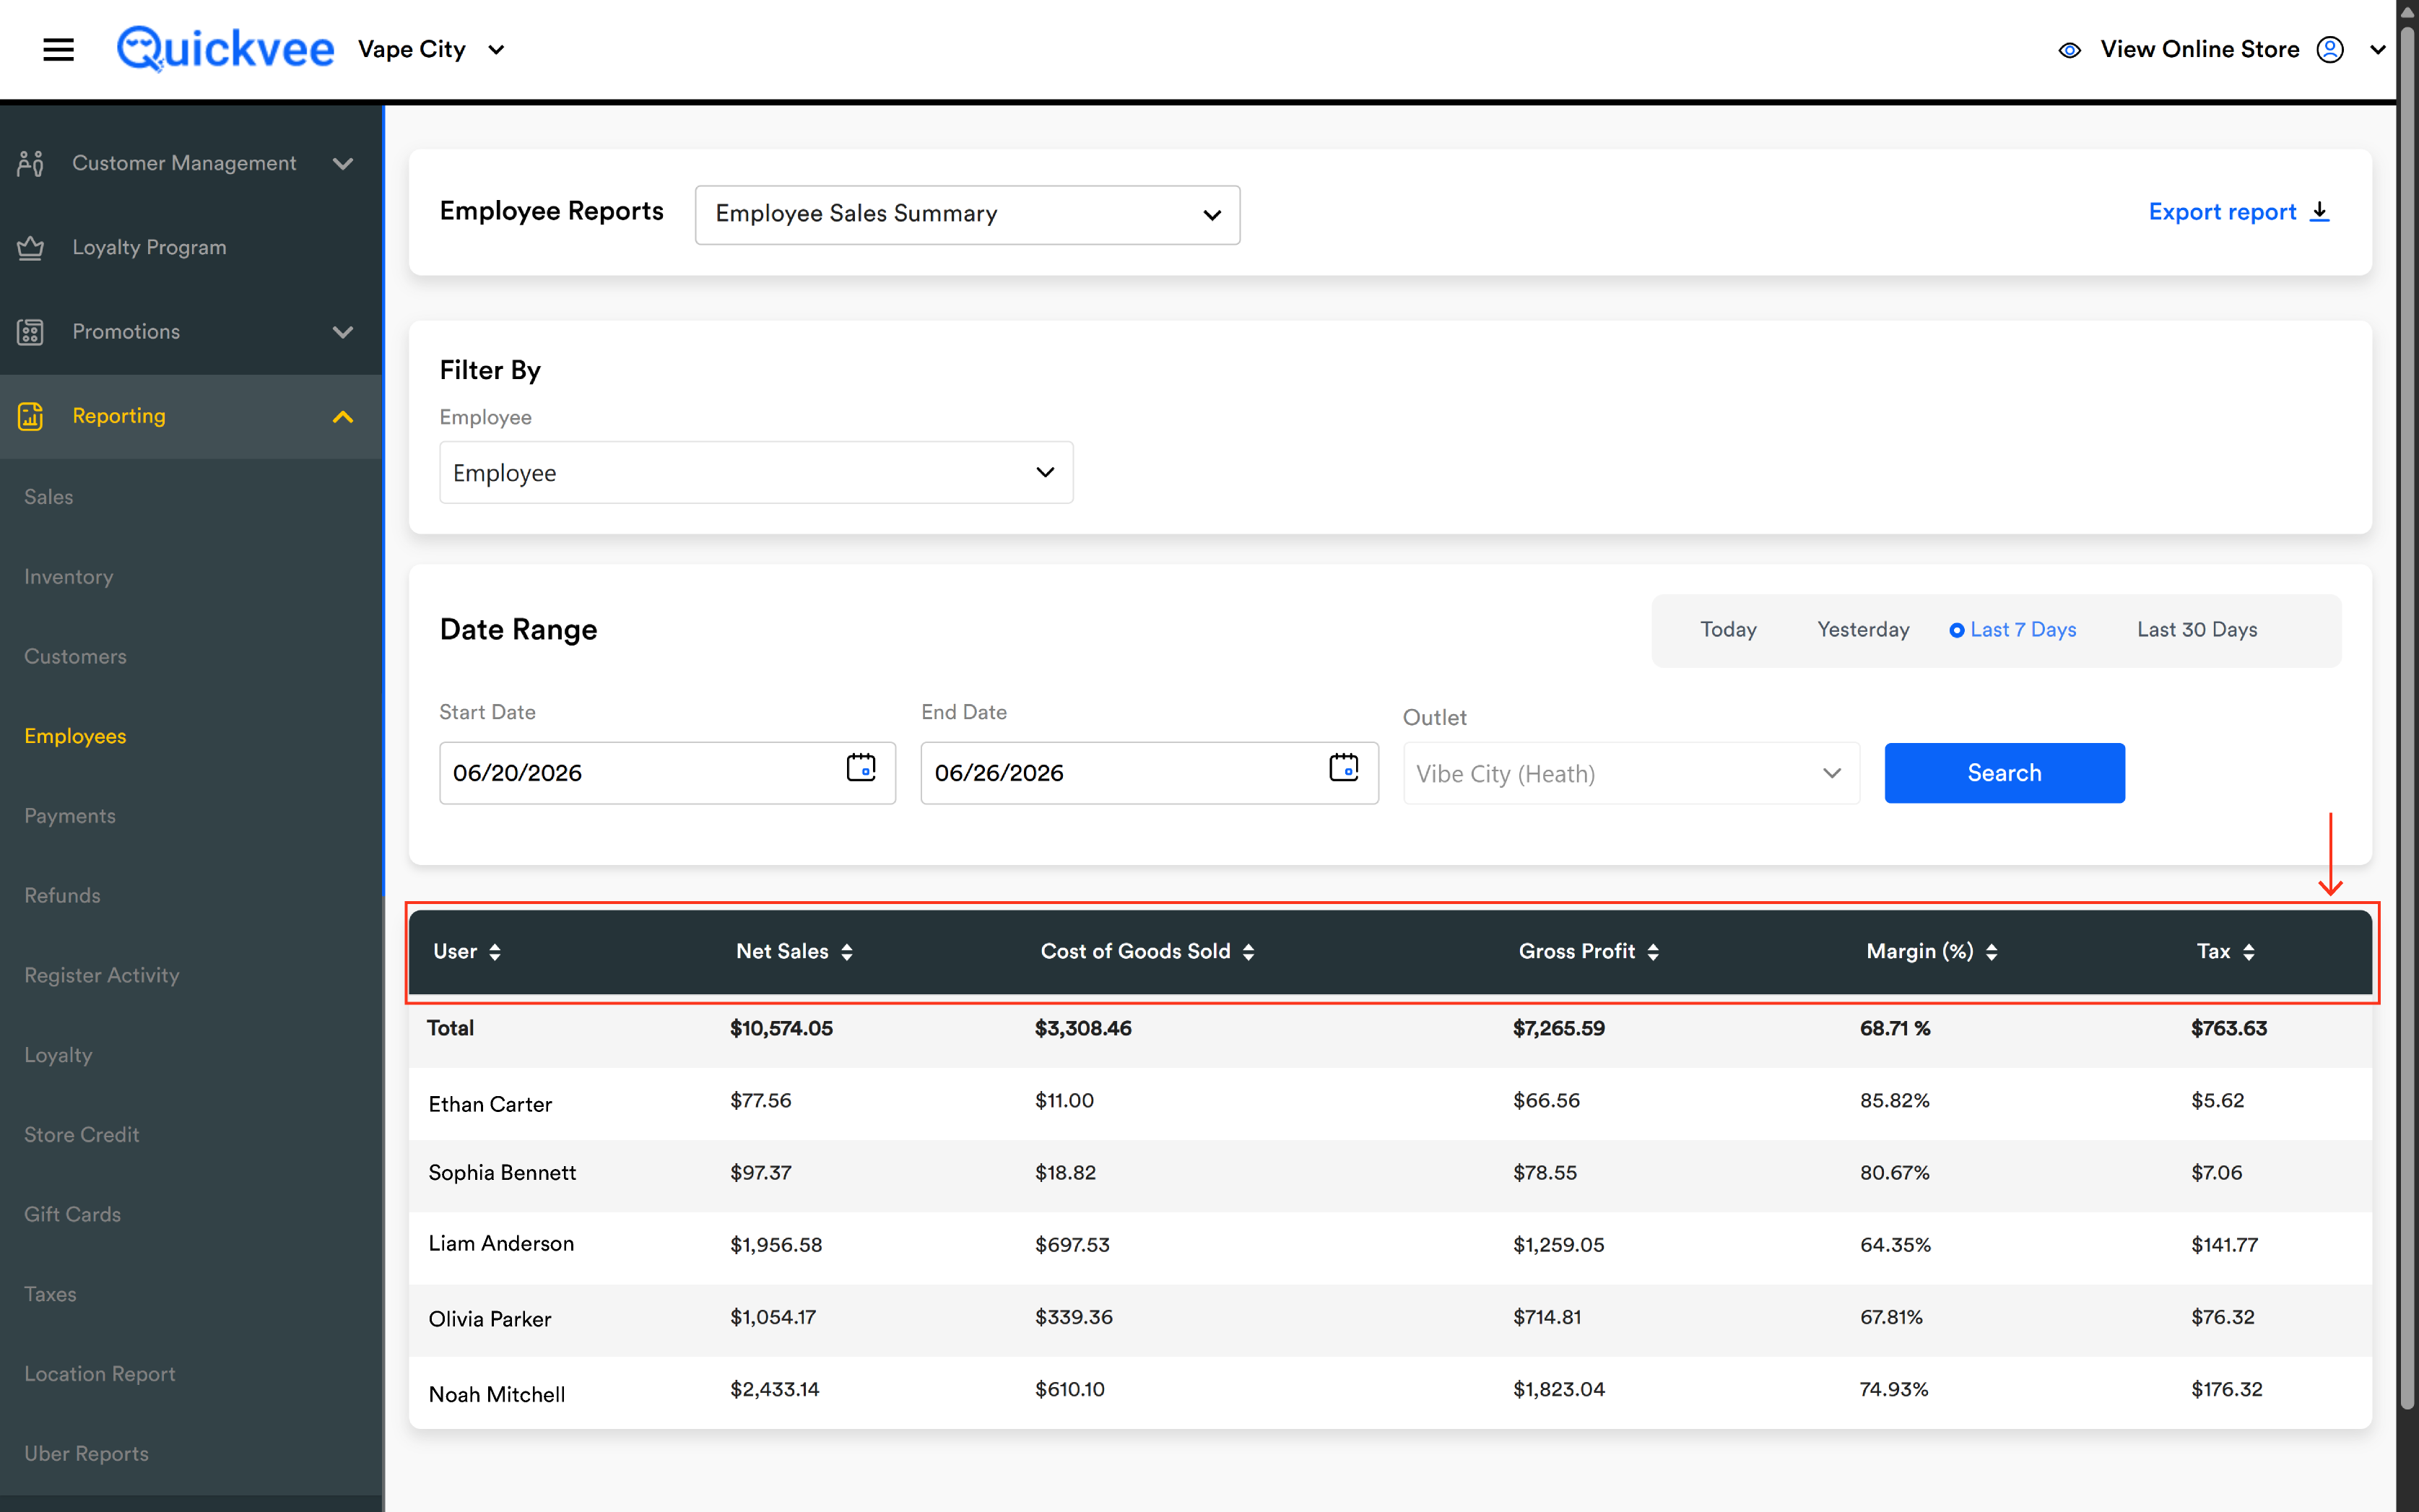
After running, the report displays as a single flat table — one row per employee, sorted into rank order. Above the per-employee rows sits a highlighted Total row that aggregates every column across all cashiers.
|
Column |
What it shows |
|---|---|
|
User |
The employee's name. Sortable A→Z or Z→A. The Total row stays pinned at the top regardless of sort. |
|
Net Sales |
The total revenue the employee rang up in the period, after all discounts. Sortable. |
|
Cost of Goods Sold |
The total cost-of-goods for everything the employee sold — units × cost per item, summed across every line. Sortable. |
|
Gross Profit |
Net Sales minus Cost of Goods Sold — the actual dollar profit each cashier produced. Sortable. |
|
Margin (%) |
The margin percentage — (Gross Profit ÷ Net Sales) × 100. Sortable. |
|
Tax |
The total sales tax collected on the employee's transactions. Sortable. |
The Total row sits at the top of the table — not the bottom. This is intentional: it's the number leadership looks at first. The row is highlighted and bold to keep it visually distinct from the per-employee rows below.
Sort by Gross Profit high-to-low to see your top profit-generating cashiers. Sort by Margin (%) high-to-low to see who's selling the right mix. The two answers are usually different — high-volume cashiers may have a thinner margin than someone who specialized in high-margin categories.
How to read unusual rows
|
Pattern |
What it usually means |
|---|---|
|
Margin = 100% on a row |
The cashier rang up items with no Cost on file — typically Custom Items entered at the register, or catalog products that haven't had a Cost per item set. Worth investigating. |
|
Margin much lower than the team average |
The cashier may be applying excessive discounts, comping items too freely, or selling primarily low-margin categories (cigarettes, lottery). Cross-check with Sales by Category per Employee for the same period. |
|
Net Sales very low, Tax high relative to Net Sales |
A few large tax-only transactions or refund offsets. Look at the refunds report for the period for that cashier. |
|
Net Sales = $0 with a row present |
The cashier signed in but only handled refunds or voids during the period. Worth confirming clock-in time matched the sales pattern. |
What to do with the report
|
Question |
How to answer it |
|---|---|
|
Who's our top performer this week? |
Quick-range Last 7 Days, leave Employee empty, run. Sort by Net Sales or Gross Profit high-to-low. |
|
Who needs coaching on margin discipline? |
Sort by Margin (%) low-to-high. Compare against the Total row's margin. |
|
What's the team's profit for the pay period? |
Set the date range to the pay period, run, read the Total row's Gross Profit. |
|
Did the new hire ring up sales yesterday? |
Quick-range Yesterday, filter Employee = (new hire), run. |
|
Are we collecting the right amount of tax across the team? |
Sum the Tax column against your POS receipts — the Total row should match the day's tax due. |
|
Who delivered the most volume this month? |
Quick-range Last 30 Days, sort by Net Sales high-to-low. |
Notes
-
The report covers the selected outlet only.
-
Only employees with at least one sale in the date range appear. Employees who clocked in but didn't ring up a sale are not listed.
-
Refunded items are excluded from Net Sales and reflected separately in the Refunds report.
-
BOGO, Mix & Match, coupon, and order-level discounts are all already applied in Net Sales — there's no separate discount column on this view.
-
Margin % is computed from the per-employee rolled-up totals, not averaged from individual transactions — it's an accurate weighted view of each cashier's mix.